 NIFTY
NIFTYBULLISH SETUP

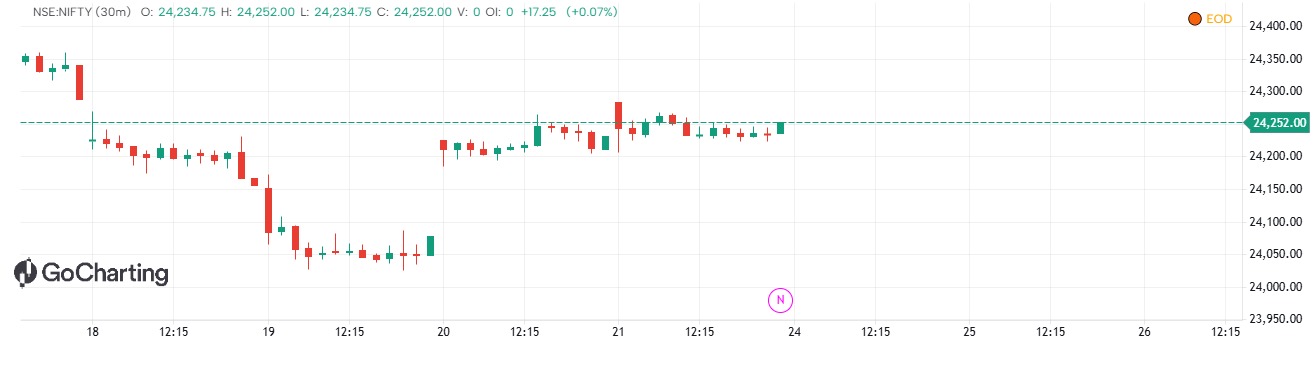
// LipiScript conversion of the NIFTY Pure Price Action - CE BUY Setup
// Corrected for Lipi syntax and validated successfully.
indicator("NIFTY Pure Price Action - CE BUY Setup", overlay=true)
swingLen = input.int(3, "Swing Length", minval=1)
rr1 = input.float(1.0, "TP1 Risk Reward", minval=0.5)
rr2 = input.float(2.0, "TP2 Risk Reward", minval=1.0)
useFVG = input.bool(true, "Use Bullish FVG")
useOB = input.bool(true, "Use Bullish Order Block")
useRetest = input.bool(true, "Require Retest")
showStructure = input.bool(true, "Show HH / HL")
showLevels = input.bool(true, "Show Entry / SL / TP")
showFVG = input.bool(true, "Show FVG")
showOB = input.bool(true, "Show Order Block")
pivotHigh = talib.pivothigh(high, swingLen, swingLen)
pivotLow = talib.pivotlow(low, swingLen, swingLen)
static float lastSwingHigh = na
static float previousSwingHigh = na
static float lastSwingLow = na
static float previousSwingLow = na
if not na(pivotHigh) {
previousSwingHigh := lastSwingHigh
lastSwingHigh := pivotHigh
}
if not na(pivotLow) {
previousSwingLow := lastSwingLow
lastSwingLow := pivotLow
}
HH = not na(pivotHigh) and not na(previousSwingHigh) and pivotHigh > previousSwingHigh
HL = not na(pivotLow) and not na(previousSwingLow) and pivotLow > previousSwingLow
plot(showStructure and HH ? pivotHigh : na, "HH", color=color.green, linewidth=3, style=plotStyle.scatter, offset=-swingLen)
plot(showStructure and HL ? pivotLow : na, "HL", color=color.green, linewidth=3, style=plotStyle.scatter, offset=-swingLen)
bullishBOS = not na(lastSwingHigh) and close > lastSwingHigh and close[1] <= lastSwingHigh
bullishCHoCH = bullishBOS and close > open
plotshape(bullishBOS, "BULLISH BOS", shape=shape.labeldown, color=color.green, textcolor=color.white, text="BOS", location=location.abovebar)
plotshape(bullishCHoCH, "CHoCH", shape=shape.labelup, color=color.lime, textcolor=color.black, text="CHoCH", location=location.belowbar)
bullishFVG = low > high[2]
static float fvgTop = na
static float fvgBottom = na
if bullishFVG {
fvgTop := low
fvgBottom := high[2]
}
fvgMid = showFVG and useFVG and not na(fvgTop) and not na(fvgBottom) ? (fvgTop + fvgBottom) / 2.0 : na
plot(fvgMid, "Bullish FVG", color=color.green, linewidth=2, style=plotStyle.stepLine)
static float obHigh = na
static float obLow = na
static int obBar = na
if bullishBOS {
int i = 1
bool foundOB = false
while i <= 10 and not foundOB {
if close[i] < open[i] {
obHigh := high[i]
obLow := low[i]
obBar := bar_index - i
foundOB := true
}
i := i + 1
}
}
obMid = showOB and useOB and not na(obHigh) and not na(obLow) ? (obHigh + obLow) / 2.0 : na
plot(obMid, "Bullish Order Block", color=color.blue, linewidth=2, style=plotStyle.stepLine)
retestBOS = not na(lastSwingHigh) and low <= lastSwingHigh and close >= lastSwingHigh
retestFVG = useFVG and not na(fvgTop) and not na(fvgBottom) and low <= fvgTop and low >= fvgBottom
retestOB = useOB and not na(obHigh) and not na(obLow) and low <= obHigh and low >= obLow
body = math.abs(close - open)
candleRange = high - low
bullishCandle = close > open and candleRange > 0 and body / candleRange >= 0.50
static bool bullishBreak = false
static int breakBar = na
if bullishBOS {
bullishBreak := true
breakBar := bar_index
}
afterBreak = bullishBreak and bar_index > breakBar
retestCondition = not useRetest or retestBOS or retestFVG or retestOB
structureBullish = not na(lastSwingHigh) and not na(lastSwingLow) and not na(previousSwingLow) and lastSwingLow > previousSwingLow
buyCE = structureBullish and bullishBreak and afterBreak and retestCondition and bullishCandle
static float entryPrice = na
static float stopLoss = na
static float tp1 = na
static float tp2 = na
static bool tradeActive = false
if buyCE and not tradeActive {
entryPrice := close
stopLoss := lastSwingLow
float risk = entryPrice - stopLoss
if risk > 0 {
tp1 := entryPrice + risk * rr1
tp2 := entryPrice + risk * rr2
tradeActive := true
}
}
stopHit = tradeActive and low <= stopLoss
tp1Hit = tradeActive and high >= tp1
tp2Hit = tradeActive and high >= tp2
if stopHit {
tradeActive := false
} else if tp2Hit {
tradeActive := false
} else if tp1Hit {
tradeActive := true
}
plot(showLevels and tradeActive ? entryPrice : na, "Entry", color=color.blue, linewidth=2)
plot(showLevels and tradeActive ? stopLoss : na, "Stop Loss", color=color.red, linewidth=2)
plot(showLevels and tradeActive ? tp1 : na, "TP1", color=color.orange, linewidth=2)
plot(showLevels and tradeActive ? tp2 : na, "TP2", color=color.green, linewidth=2)
plotshape(buyCE, "BUY CE", shape=shape.labelup, color=color.green, textcolor=color.white, text="BUY CE", location=location.belowbar)
ema21 = talib.ema(close, 21)
plot(ema21, "EMA 21", color=color.orange, linewidth=2)
The information and publications are not meant to be, and do not constitute, financial, investment, trading, or other types of advice or recommendations supplied or endorsed by GoCharting. Read more in the Terms of Use.
Comments (0)
Loading comments…