Community Trading Analysis & Chart Ideas
Explore Market Insights · Technical Analysis · Trading Ideas
Discover trading ideas from the GoCharting community
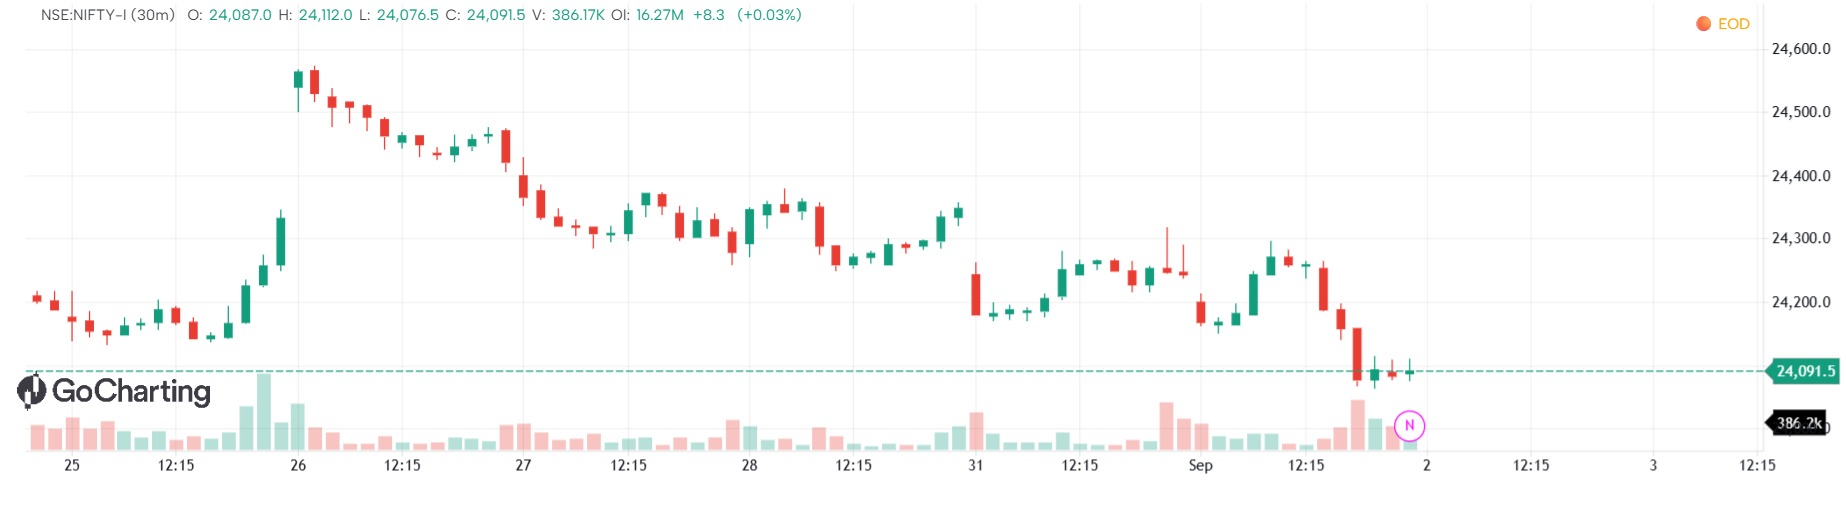
 NIFTY-I
Candle Movement Point

 neutral
Multi-Factor Trend Confluence – Bull & Sell Signals
Multi-Factor Trend Confluence – Bull & Sell Signals is a trend-following confirmation indicator designed to identify higher-quality bullish and bearish trading opportunities while filtering out weaker market signals. The indicator combines four independent areas of technical confirmation: 1. Trend DirectionA 21-period EMA and 55-period EMA determine the intermediate trend.Bullish conditions require the fast EMA to remain above the slow EMA.Bearish conditions require the fast EMA to remain below the slow EMA.2. Long-Term Trend FilterA 200-period EMA acts as the primary market regime filter.Bull signals are considered only when price is above the 200 EMA.Sell signals are considered only when price is below the 200 EMA.This helps avoid taking signals directly against the dominant trend.3. Momentum ConfirmationRSI is used to confirm directional momentum.By default, bullish momentum requires RSI above 55.Bearish momentum requires RSI below 45.The neutral area between these levels helps filter sideways conditions.4. MACD Momentum ConfirmationMACD-style momentum is calculated using 12 and 26 period EMAs together with a 9-period signal EMA.Bullish setups require the MACD line to be above its signal line and above zero.Bearish setups require the MACD line to be below its signal line and below zero. Optional Volume Confirmation:Traders can enable the volume filter to require current volumeto exceed its 20-period moving average before a signal is accepted.This can help filter price movements occurring on relatively weak volume. Bull Signal:A BULL signal appears when bullish trend, long-term trend,RSI momentum, MACD momentum, and the optional volume conditionsimultaneously agree.A new marker is generated only when the complete bullish setuptransitions from false to true.Sell Signal:A SELL signal appears when bearish trend, long-term trend,RSI momentum, MACD momentum, and the optional volume conditionsimultaneously agree.A new marker is generated only when the complete bearish setuptransitions from false to true. Chart Interpretation:Green bars indicate that the complete bullish setup is active.Red bars indicate that the complete bearish setup is active.The 21 EMA provides the faster trend reference.The 55 EMA provides intermediate trend confirmation.The 200 EMA represents the broader directional filter.Suggested Usage:The indicator is designed as a confirmation system rather thana prediction system.Signals will generally be more selective because several conditionsmust agree before a BULL or SELL marker is produced.Settings should be tested and optimized for the instrument,timeframe, volatility environment, and trading style being used. Important:No technical indicator can guarantee a fixed accuracy such as 60%across every instrument and timeframe.Historical and forward testing should be used to evaluate signalperformance before the indicator is incorporated into a trading system.Disclaimer:This indicator is intended for educational and analytical purposes only. It does not constitute financial advice or a guarantee of future results.indicator("Multi-Factor Trend Confluence – Bull & Sell Signals", shorttitle="MTC Bull/Sell", overlay=true)

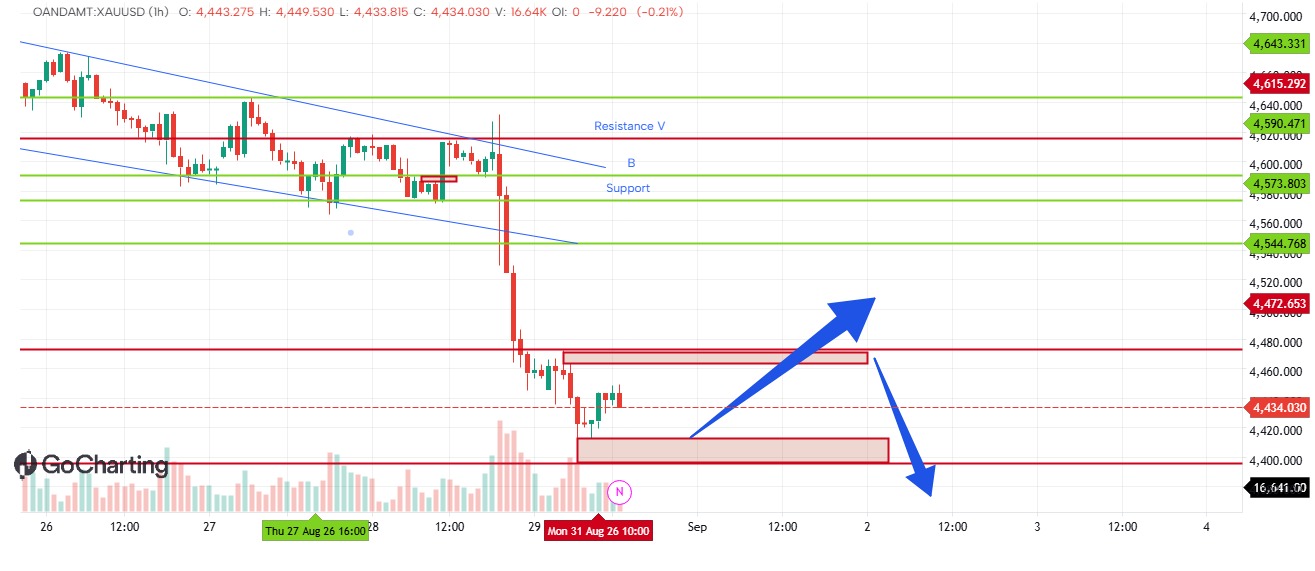
XauUSD intraday levels
For today as it is Monday market is in range, Moniter the levels 4460 and 4400, these are short term two levels if either break we will ride the directional rallies. let wait for clear direction of market do not rush wait is the key to win. either level holds we will sell from upper level and buy from lower level.

Institutional Order Flow
INSTITUTIONAL ORDER FLOW =========================== OVERVIEW -------- Institutional Order Flow is a price-action based volume indicator designed to visually highlight moments where large volume enters the market but fails to move price significantly in that direction. This phenomenon is commonly referred to as "absorption" — where aggressive buying or selling is being absorbed by opposing limit orders, often indicating the presence of large institutional players, smart money, or algorithmic trading activity. The indicator plots colored bubbles directly on the price chart at the exact bar where absorption is detected, with the SIZE of each bubble scaling dynamically based on the strength of the absorption event. Bigger bubbles represent stronger, more significant absorption — helping traders instantly distinguish minor noise from major, potentially market-moving institutional activity. WHAT IS ABSORPTION? -------------------- Absorption occurs when one side of the market (buyers or sellers) pushes aggressively into price, generating a volume spike, but the opposing side "absorbs" that pressure — resulting in a long wick and little to no net price movement in the aggressor's favor. This is often the footprint left behind by large institutional orders working against retail flow. - BUY ABSORPTION: Heavy selling pressure hits the market (often visible as a long lower wick), but buyers step in and absorb it, preventing price from falling further. This can signal a potential reversal to the upside or the presence of a strong institutional support zone. - SELL ABSORPTION: Heavy buying pressure hits the market (long upper wick), but sellers absorb it, capping the advance. This can signal a potential reversal to the downside or a strong institutional resistance zone. HOW IT WORKS ------------ The indicator combines two independent conditions to confirm institutional absorption: 1. VOLUME SPIKE DETECTION The script calculates a moving average of volume over a user-defined lookback period (default: 20 bars). A bar is flagged as "high volume" when its volume exceeds this average multiplied by a sensitivity factor (default: 1.5x). This filters out ordinary volume fluctuations and isolates genuine institutional-sized spikes. 2. WICK RATIO DETECTION For each bar, the script measures the lower wick (rejection of lower prices) and upper wick (rejection of higher prices) relative to the bar's total range (high minus low). A minimum wick ratio (default: 50%) must be met for a bar to qualify as showing rejection strong enough to represent institutional absorption rather than simple continuation. Only bars that satisfy BOTH conditions simultaneously — a volume spike AND a dominant wick — are marked as institutional order flow events. DYNAMIC BUBBLE SIZING ----------------------- Once a bar is confirmed as an absorption event, the indicator calculates a "strength score" for that bar. This score combines: - How far volume exceeded the volume spike threshold - How far the wick ratio exceeded the minimum wick threshold The two factors are multiplied together, so an event with BOTH extremely high volume AND an extremely long wick — the clearest sign of large institutional participation — produces a much higher strength score than an event that only barely qualifies. This strength score is then mapped into four visual size tiers: SMALL - Minor absorption, volume/wick just above threshold MEDIUM - Moderate absorption, noticeably above threshold LARGE - Strong absorption, well above threshold XL - Extreme absorption, likely large institutional trades Each tier is rendered with a progressively larger bubble, giving traders an immediate visual sense of institutional conviction strength without needing to hover over or inspect individual bars. INPUTS ------ - Volume Average Length (default 20) Number of bars used to calculate the baseline average volume. Shorter lengths make the indicator more reactive to recent volume changes; longer lengths smooth out noise and focus on more significant institutional-sized spikes. - Volume Spike Multiplier (default 1.5) How many times above average volume a bar must be to qualify as a volume spike. Increasing this value filters for only the most extreme, likely institutional, volume events. - Minimum Wick Ratio (default 0.50) The minimum proportion of the bar's total range that must be composed of rejection wick. Higher values require more dramatic rejection before flagging institutional absorption. VISUAL OUTPUT -------------- - LIME/GREEN bubbles (below price): Buy-side institutional absorption — sellers were absorbed, potential bullish signal or support forming. - RED bubbles (above price): Sell-side institutional absorption — buyers were absorbed, potential bearish signal or resistance forming. - Bubble size: Represents the relative strength of the institutional order flow event, from small (minor) to XL (extreme/high-conviction). HOW TO USE IT -------------- 1. Watch for clusters of same-colored bubbles, which may indicate a developing institutional support or resistance zone being repeatedly defended. 2. Pay closer attention to LARGE and XL bubbles, as these represent the most significant absorption events and are more likely to be associated with genuine institutional or large-trader activity. 3. Combine with other tools such as trend structure, order blocks, or key support/resistance levels for higher-confidence signals. This indicator is best used as a confirmation tool rather than a standalone entry trigger. 4. Consider adjusting the Volume Average Length and Volume Spike Multiplier depending on the asset and timeframe — highly liquid assets or lower timeframes may require more conservative (higher) thresholds to avoid excessive signals. LIMITATIONS ------------ - This indicator is reactive, not predictive — it identifies institutional order flow footprints after the bar has closed and does not forecast future price movement. - Volume data quality varies by asset and exchange. On markets with incomplete or aggregated volume feeds (e.g., some spot crypto pairs or forex), signal reliability may be reduced. - Absorption does not guarantee a reversal; it only indicates that significant opposing pressure was present. Price may continue in the original direction after a period of consolidation. - As with all volume/wick-based tools, this indicator works best in liquid markets with consistent volume reporting, and may be less reliable during illiquid sessions, holidays, or on synthetic indices. - The term "institutional" refers to the inferred size/character of the order flow based on volume and price rejection patterns — it does not confirm the actual identity or intent of market participants. DISCLAIMER ----------- This indicator is provided for informational and educational purposes only. It does not constitute financial advice, and past patterns of institutional order flow do not guarantee future results. Always use proper risk management and combine this tool with your own independent analysis before making trading decisions.

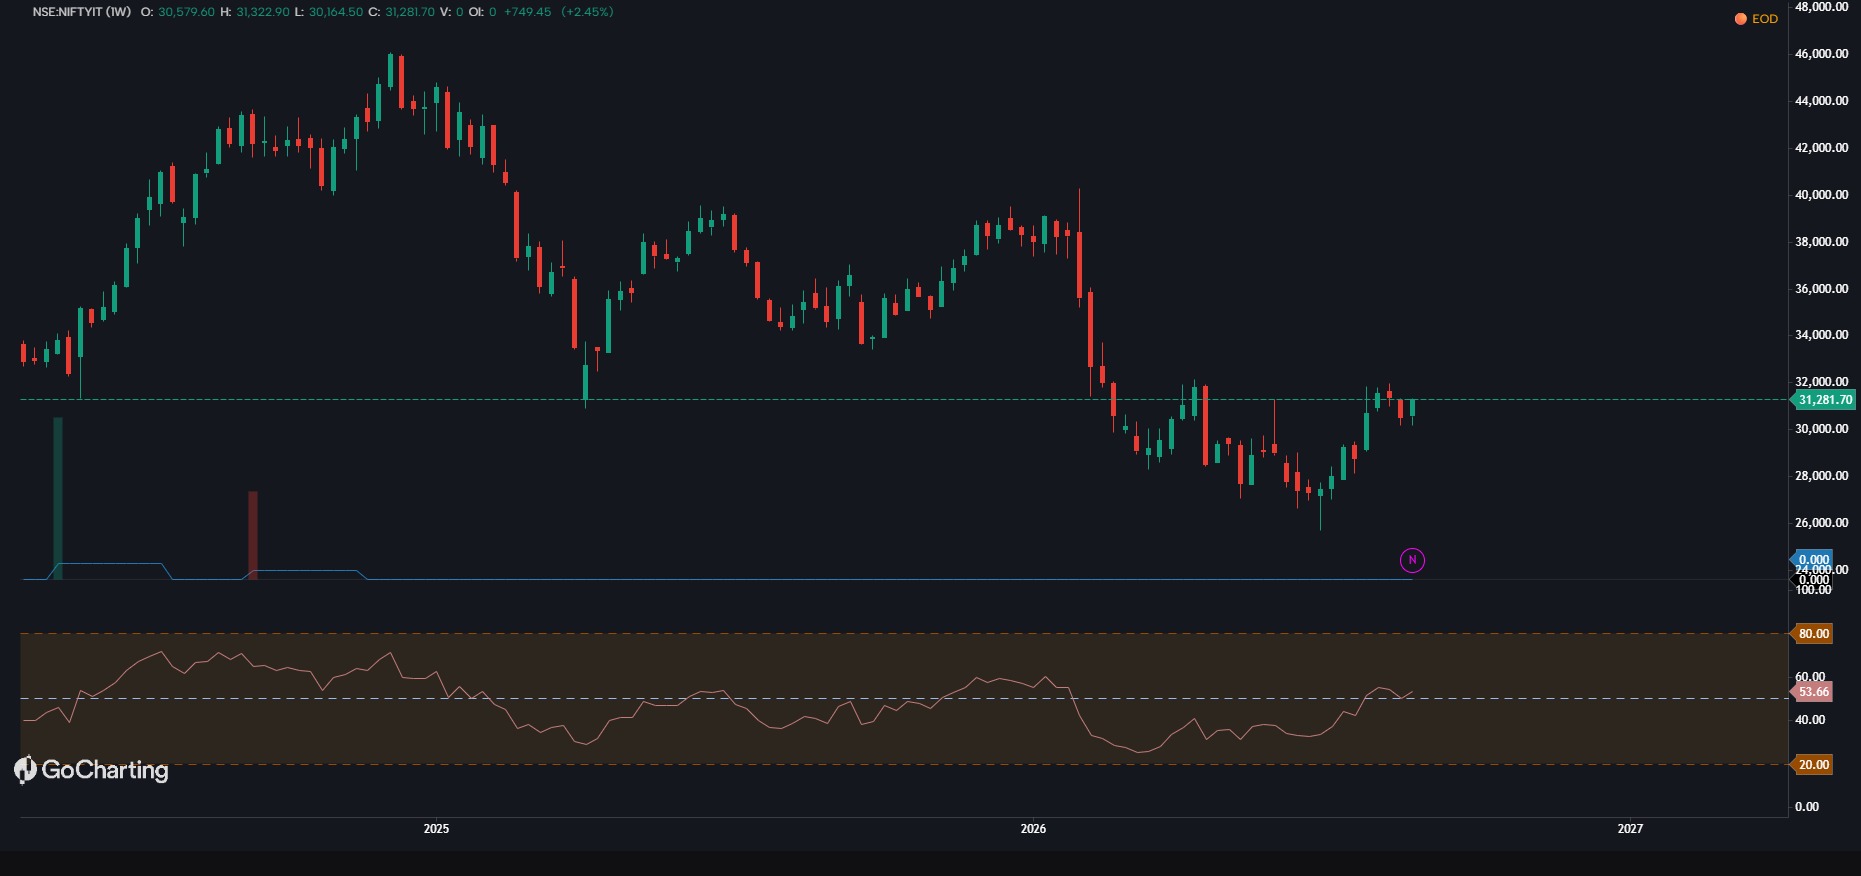 BullishNIFTYIT
It sector leading the rally
It sector looks very good for cing month. it stock will out perfom market. its on the verge of breakout 32000 level after breajing out this level it will go till 39000.

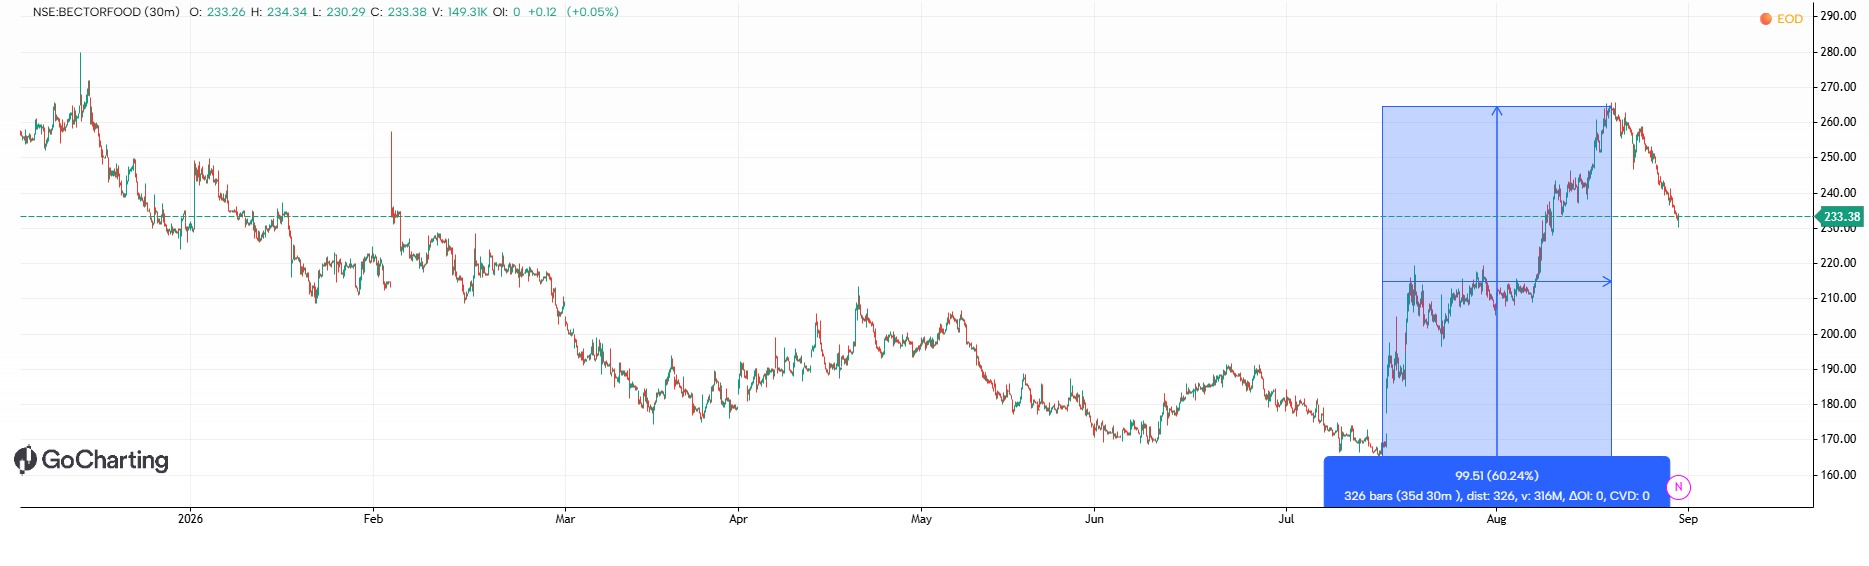 neutralBECTORFOOD
upside_20
20% continuous upside with every candle green Price gain: +20% or more over your chosen periodCandles: predominantly greenFew or no red candlesHigher highs + higher lowsVolume: ideally increasing along with the moveNo major upper wicks → stronger buying pressure

 neutral
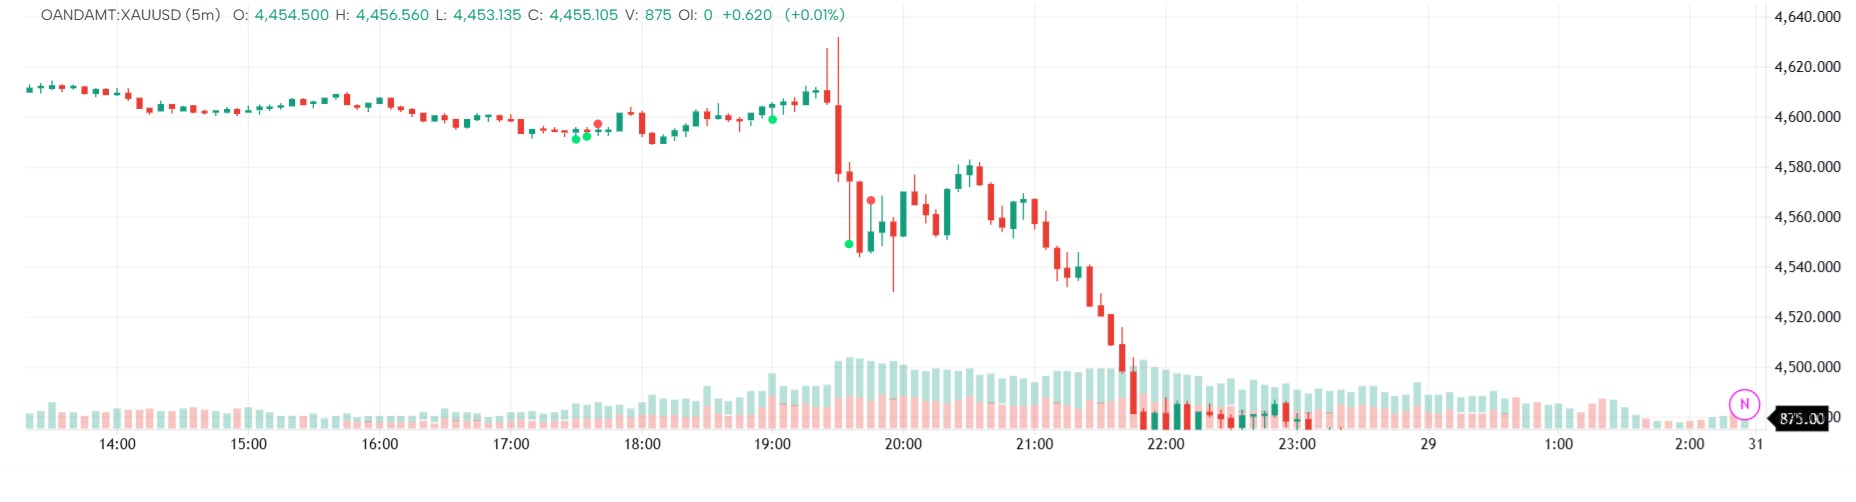
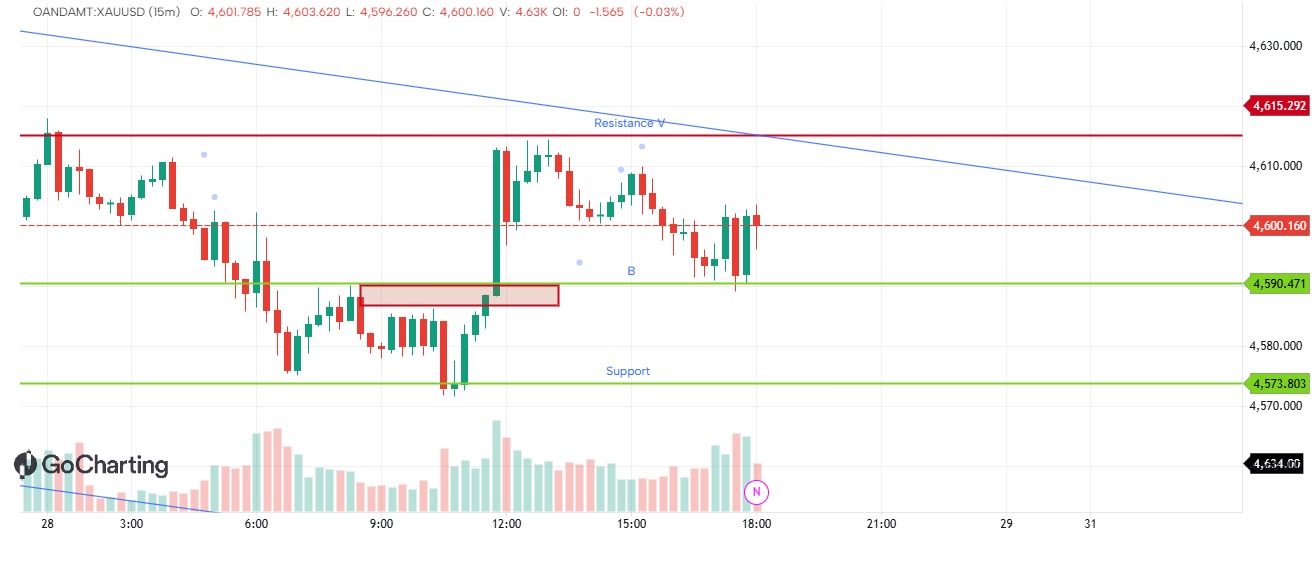
XauUsd Intraday analysis By pips master
The gold is stuck inside a closed range the key levels are 4620 upper resistance if broken with intensive volume the price may push upside to major semi resistance at downside the key level is 4572, if this level breached price will be pushed 4550, ahead of warsh speech keep protection of your capital.if you found this analysis useful hit like and follow
 NIFTY
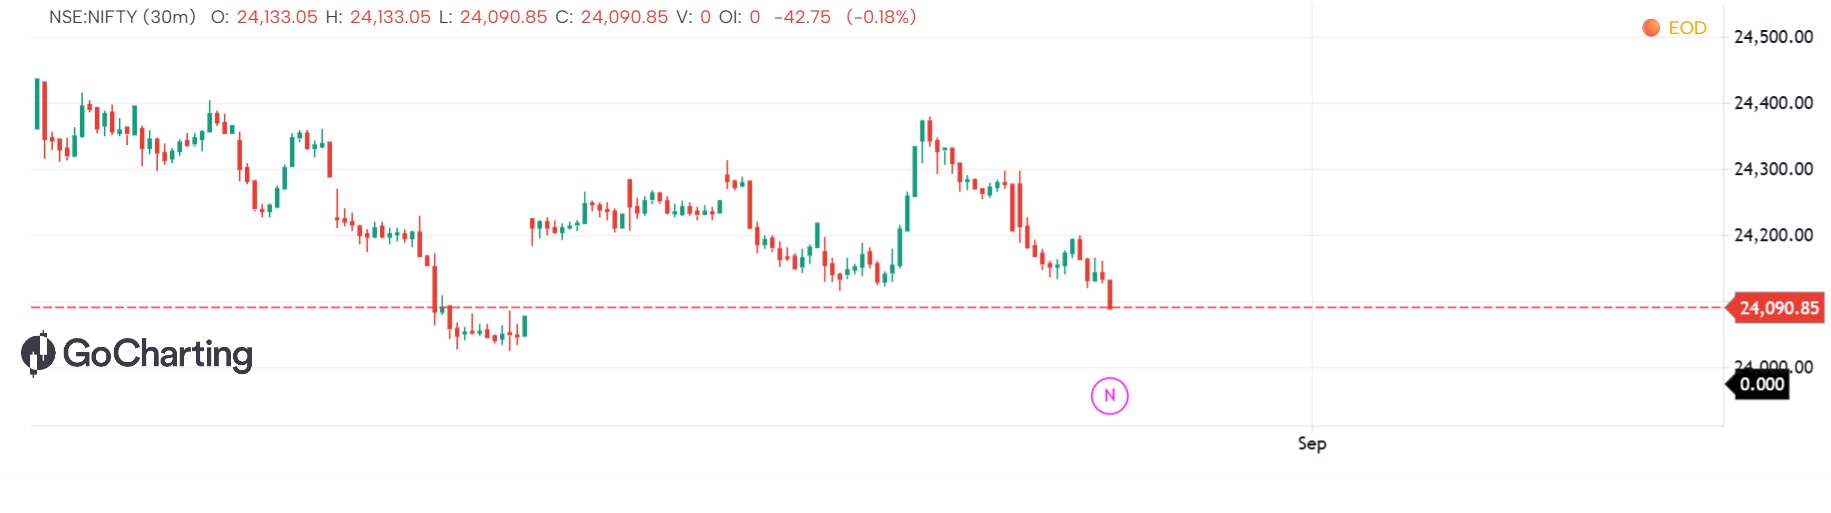
NIFTYfxn asia session
liquidity sweep just after asia session

 Bearish
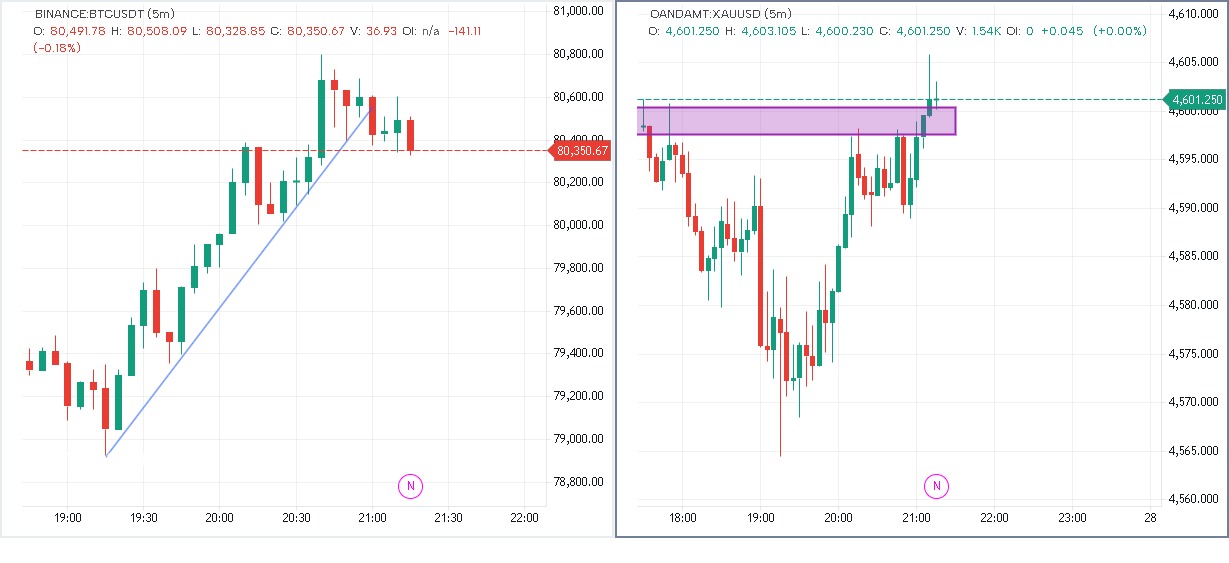
The primary tab displays XAUUSD, but the layout contains two split 5-minute charts: BINANCE:BTCUSDT on the left and OANDAMT:XAUUSD on the right. News Driver: Both charts display a news event marker (
Left Chart: BINANCE:BTCUSDT (5m) Trendline Breakdown: BTC staged an aggressive impulse up to ~$80,750 before losing momentum. Price broke cleanly below the ascending blue support trendline. Bearish Follow-Through: The breakdown candle is followed by tight, indecisive red candles failing to reclaim the trendline, currently trading at 80,389.64. Immediate Risk: Failure to reclaim 80,500 opens a retest of the prior consolidation base around 80,000–79,800. Right Chart: OANDAMT:XAUUSD (5m) Resistance Liquidity Sweep: Gold completed a deep V-shape recovery from the 4,565 lows into the shaded purple resistance zone (4,598–4,602). Wick Rejection at Key Level: Price spiked to a high of ~4,608 to sweep liquidity above resistance, but the candle pulled back, leaving a massive upper wick and currently closing back down near 4,601.35. Immediate Risk: This is a classic liquidity grab/exhaustion signature at resistance. If the next 5m candle fails to hold above 4,600, expect a sharp mean reversion back toward the 4,585–4,590 order block. Key Takeaways BTCUSDT: Short-term trend failure; momentum favors bears unless 80,550 is reclaimed on volume. XAUUSD: Trapped aggressive breakout buyers with a long wick at major resistance; high probability of a corrective pullback.

 neutral
ORB ASIA SESSION
It is an opening range breakout strategy made for GOLD with multiple customization options. I added EMA based Exit aswell as Fix Risk to Reward Ratio Exits on TP. I also added a fix amount of risk in each trade.

 Bullish
 BTCUSDT
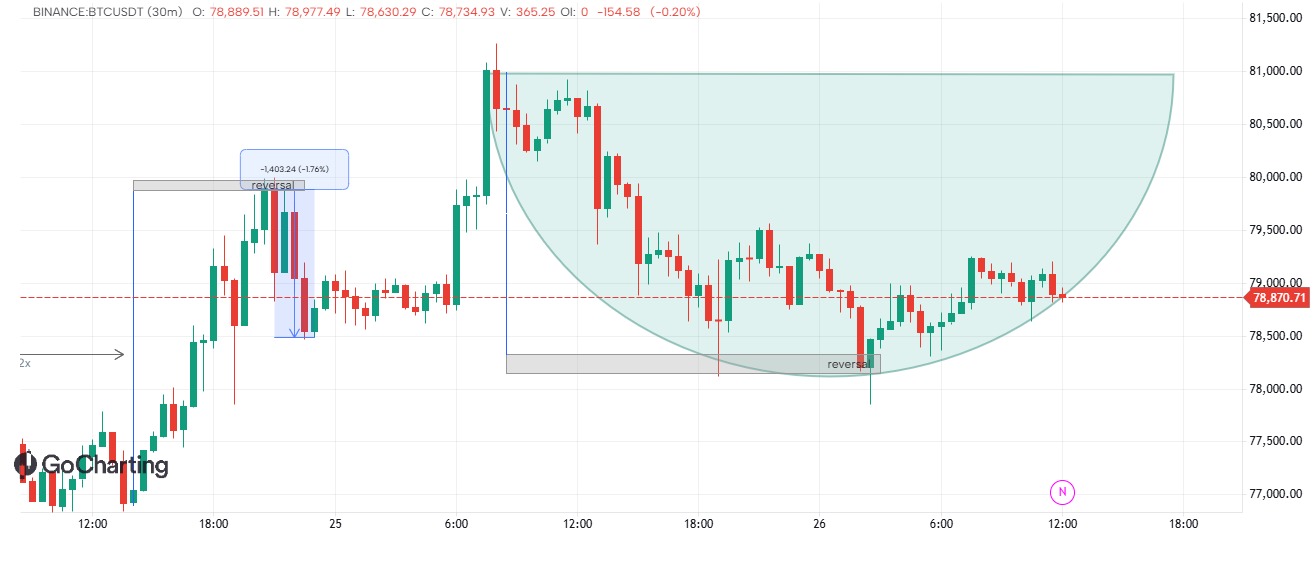
BTCUSDT 30M — Double Confirmation Setup
Two things are catching my attention: 🔹 $78,240 reversal zone — already showed a reaction🔹 Arc formation — price is gradually building toward the upper boundary🔹 $78.8K area — I want to see a strong bullish candle/engulfing confirmation here If buyers confirm the breakout and the arc continues to complete, the next major target is $81K 🎯 Bullish scenario: $78.8K confirmation → arc completion → $81K ⚠️ If BTC loses the $78,240 reversal zone with strong bearish momentum, this setup becomes invalid. For now, patience — confirmation first, entry second. 📊 #Bitcoin #BTC #BTCUSDT #CryptoTrading #TechnicalAnalysis

 Neutral
FX session indicator
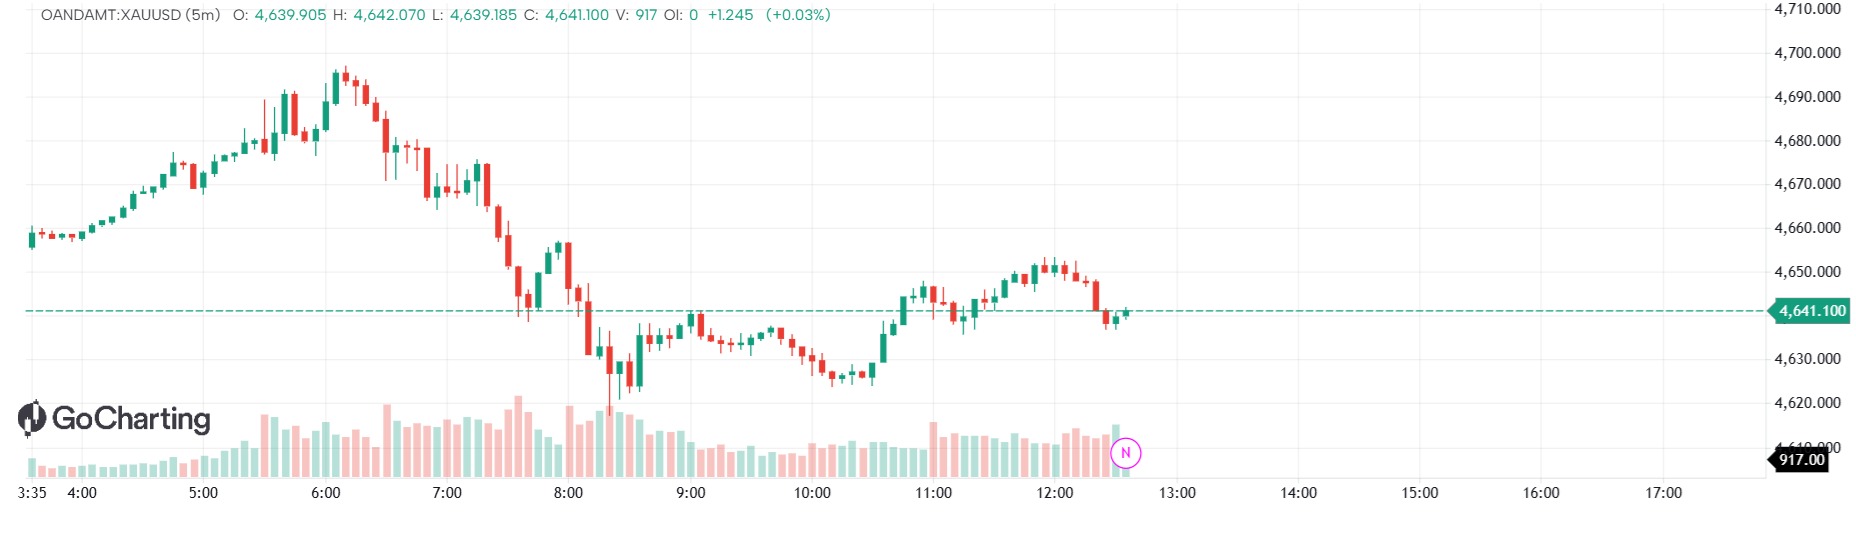
in this indicator you know the timing of forex session opening and closing like when the asua session is opened and close and the london session opening and closing time and newyork session opening closing

 Neutral
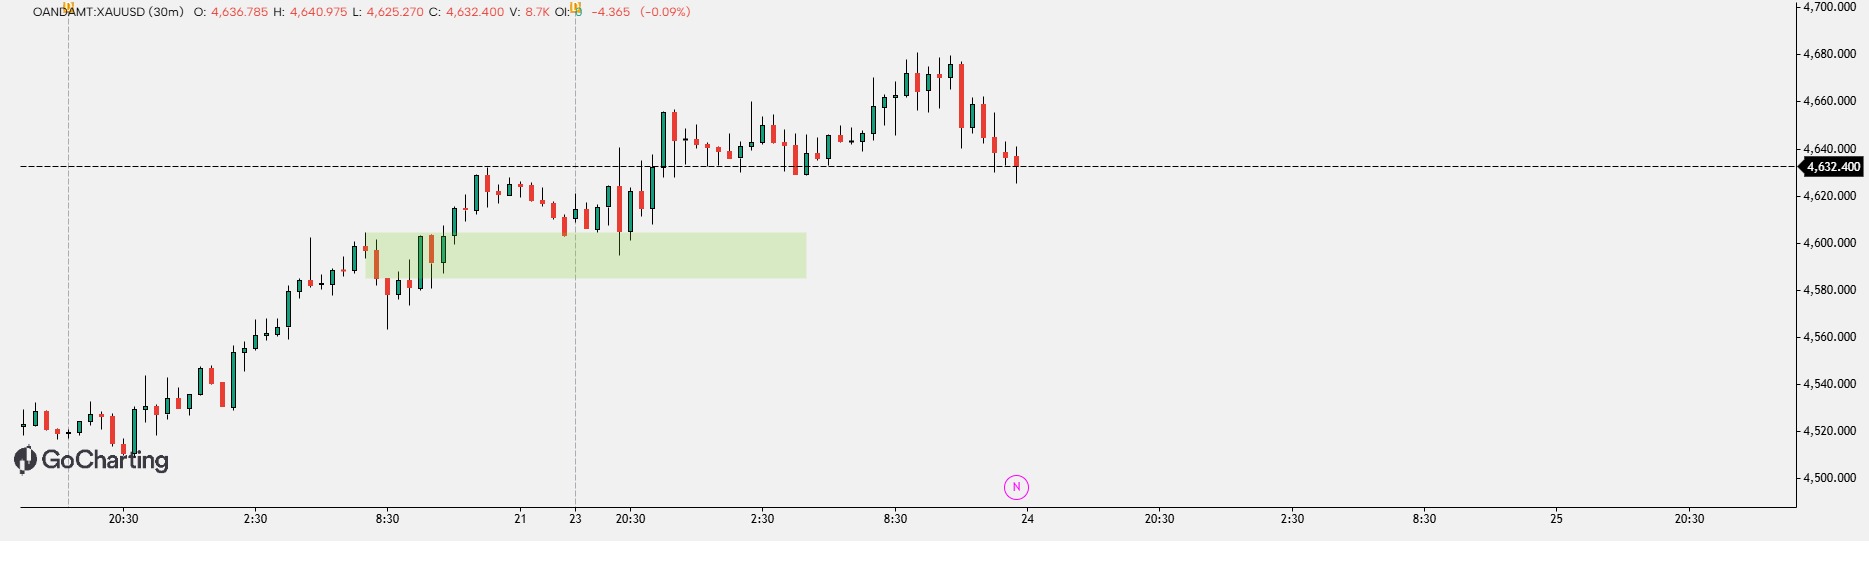
Session, ASIA, NY, London, London close
This indicator only for forex market, just for the session confirmation. using this indicator you can exactly know when which session is start or end and its help you to get a accurate know why some big moves come and help you to take good trade.

 BearishBTCUSDT
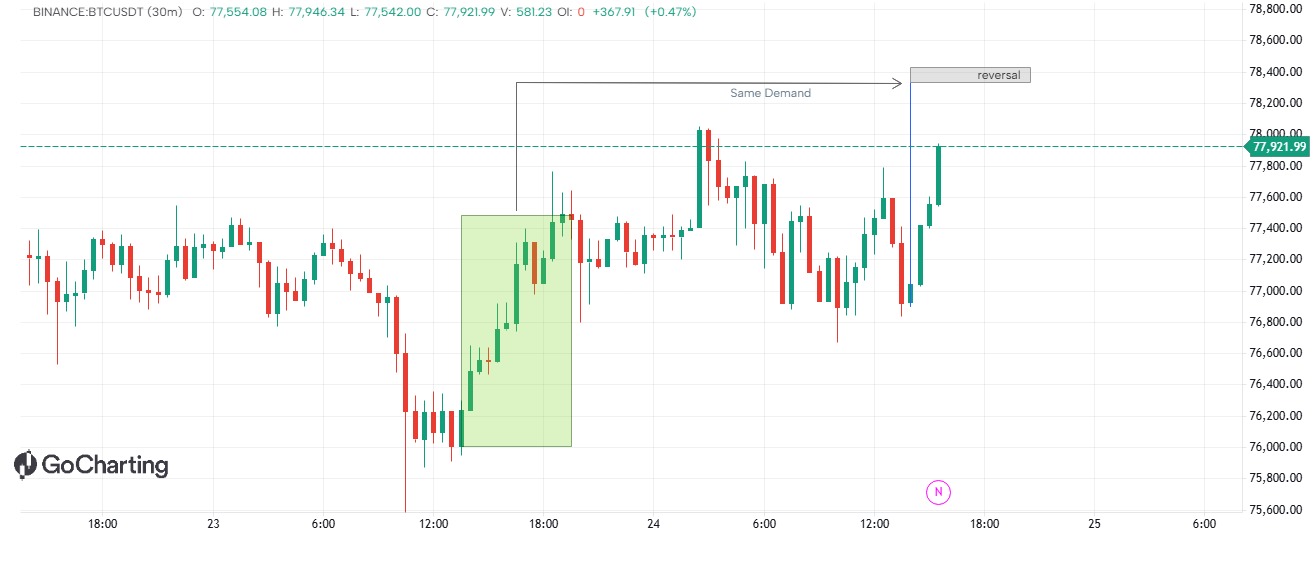
BTCUSDT 30M | Analysis
BTC is again respecting the previous demand zone, which triggered the strong move from the 76K area. Price has now pushed toward 77.9K and is approaching a small reversal area around 78.4K. 📌 My setup:• 78.4K = key reversal/resistance zone• Waiting for bearish rejection / bearish engulfing• Possible downside: 77.4K → 77.0K → 76.8K• Clean breakout above 78.4K could invalidate the short setup No confirmation = no trade. Watching the reaction. 📊 #BTC #BTCUSDT #Bitcoin #CryptoTrading
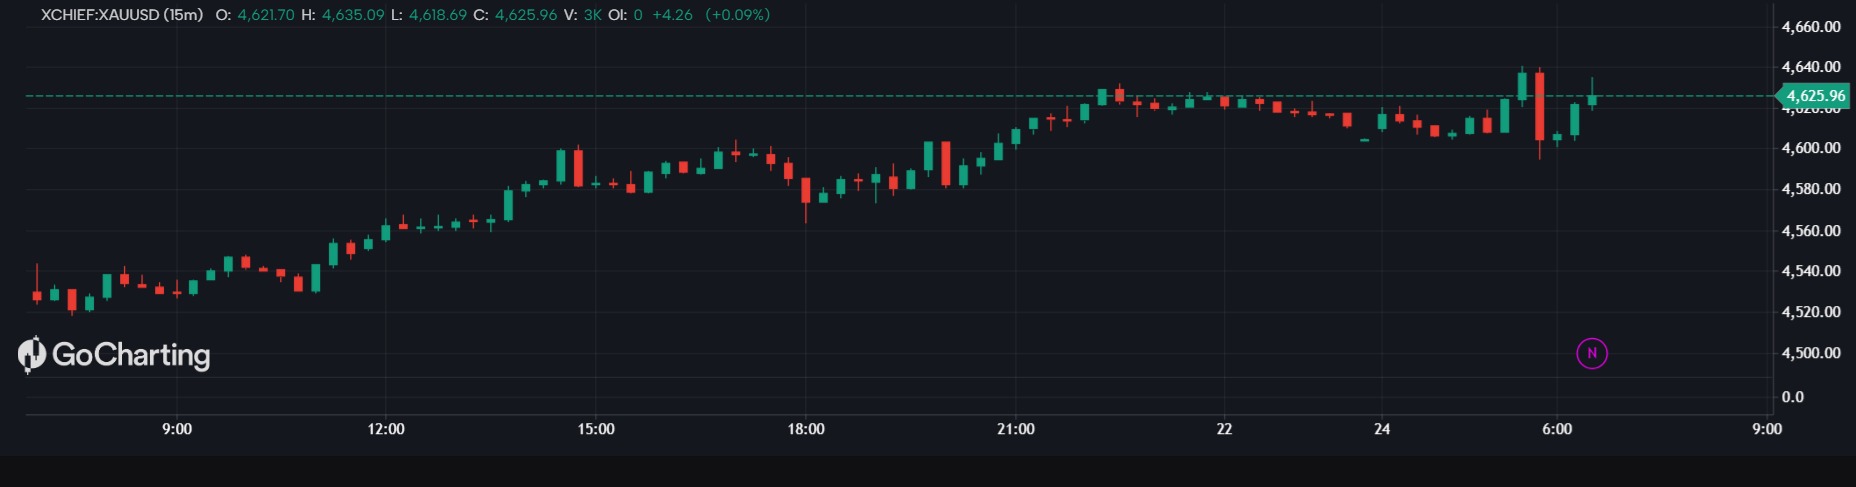
My 100 Indicator

 BullishNIFTY
BULLISH SETUP
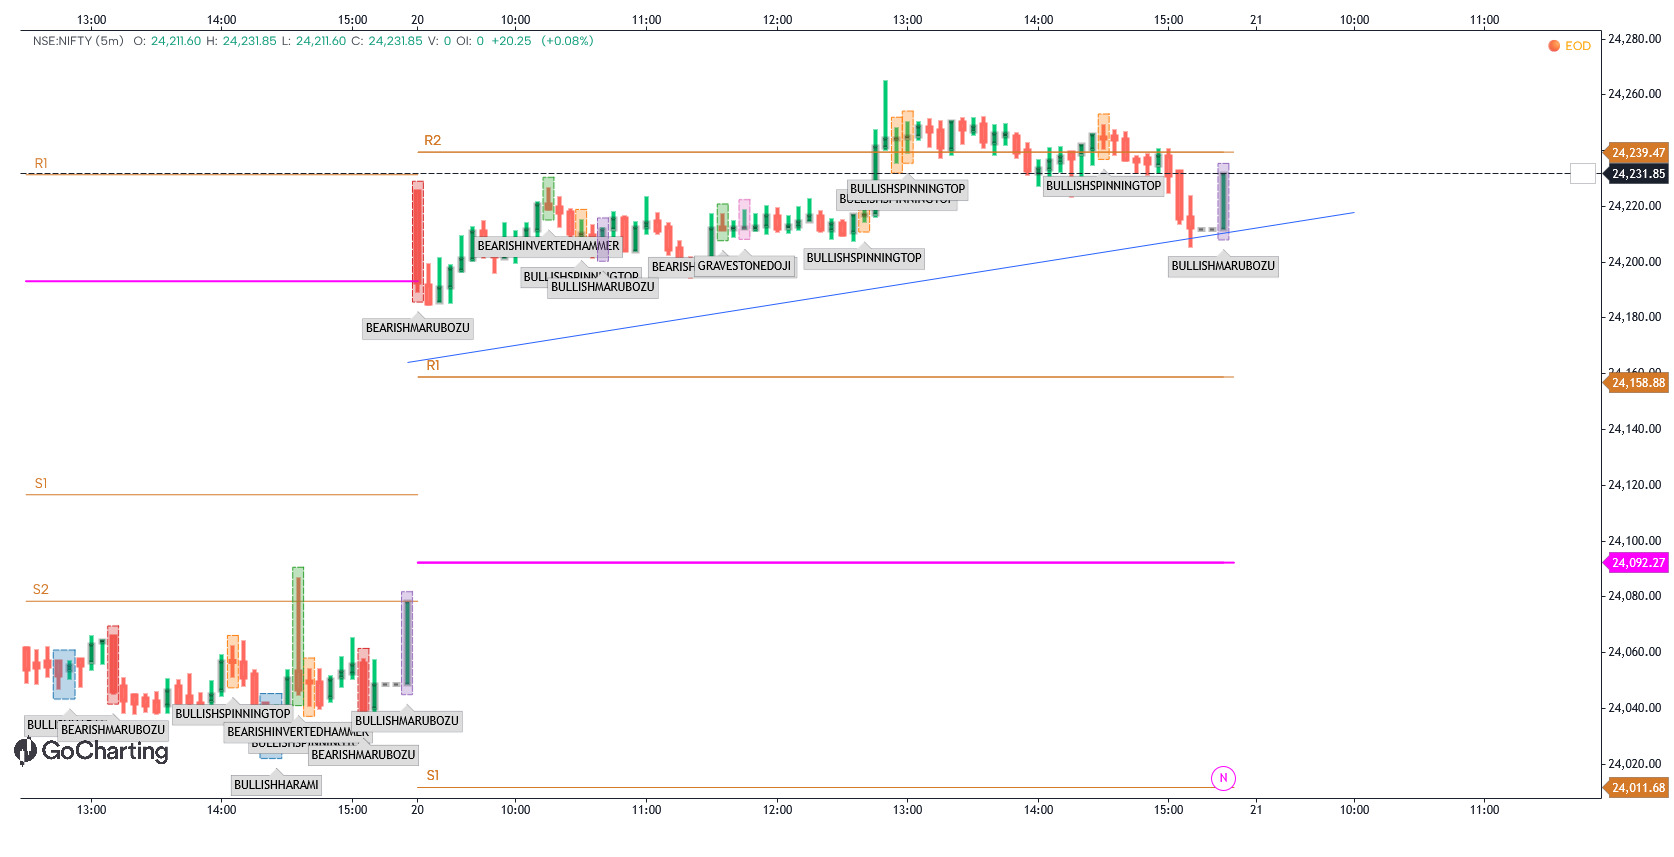
// LipiScript conversion of the NIFTY Pure Price Action - CE BUY Setup // Corrected for Lipi syntax and validated successfully. indicator("NIFTY Pure Price Action - CE BUY Setup", overlay=true) swingLen = input.int(3, "Swing Length", minval=1) rr1 = input.float(1.0, "TP1 Risk Reward", minval=0.5) rr2 = input.float(2.0, "TP2 Risk Reward", minval=1.0) useFVG = input.bool(true, "Use Bullish FVG") useOB = input.bool(true, "Use Bullish Order Block") useRetest = input.bool(true, "Require Retest") showStructure = input.bool(true, "Show HH / HL") showLevels = input.bool(true, "Show Entry / SL / TP") showFVG = input.bool(true, "Show FVG") showOB = input.bool(true, "Show Order Block") pivotHigh = talib.pivothigh(high, swingLen, swingLen) pivotLow = talib.pivotlow(low, swingLen, swingLen) static float lastSwingHigh = na static float previousSwingHigh = na static float lastSwingLow = na static float previousSwingLow = na if not na(pivotHigh) { previousSwingHigh := lastSwingHigh lastSwingHigh := pivotHigh } if not na(pivotLow) { previousSwingLow := lastSwingLow lastSwingLow := pivotLow } HH = not na(pivotHigh) and not na(previousSwingHigh) and pivotHigh > previousSwingHigh HL = not na(pivotLow) and not na(previousSwingLow) and pivotLow > previousSwingLow plot(showStructure and HH ? pivotHigh : na, "HH", color=color.green, linewidth=3, style=plotStyle.scatter, offset=-swingLen) plot(showStructure and HL ? pivotLow : na, "HL", color=color.green, linewidth=3, style=plotStyle.scatter, offset=-swingLen) bullishBOS = not na(lastSwingHigh) and close > lastSwingHigh and close[1] bullishCHoCH = bullishBOS and close > open plotshape(bullishBOS, "BULLISH BOS", shape=shape.labeldown, color=color.green, textcolor=color.white, text="BOS", location=location.abovebar) plotshape(bullishCHoCH, "CHoCH", shape=shape.labelup, color=color.lime, textcolor=color.black, text="CHoCH", location=location.belowbar) bullishFVG = low > high[2] static float fvgTop = na static float fvgBottom = na if bullishFVG { fvgTop := low fvgBottom := high[2] } fvgMid = showFVG and useFVG and not na(fvgTop) and not na(fvgBottom) ? (fvgTop + fvgBottom) / 2.0 : na plot(fvgMid, "Bullish FVG", color=color.green, linewidth=2, style=plotStyle.stepLine) static float obHigh = na static float obLow = na static int obBar = na if bullishBOS { int i = 1 bool foundOB = false while i if close[i] obHigh := high[i] obLow := low[i] obBar := bar_index - i foundOB := true } i := i + 1 } } obMid = showOB and useOB and not na(obHigh) and not na(obLow) ? (obHigh + obLow) / 2.0 : na plot(obMid, "Bullish Order Block", color=color.blue, linewidth=2, style=plotStyle.stepLine) retestBOS = not na(lastSwingHigh) and low = lastSwingHigh retestFVG = useFVG and not na(fvgTop) and not na(fvgBottom) and low = fvgBottom retestOB = useOB and not na(obHigh) and not na(obLow) and low = obLow body = math.abs(close - open) candleRange = high - low bullishCandle = close > open and candleRange > 0 and body / candleRange >= 0.50 static bool bullishBreak = false static int breakBar = na if bullishBOS { bullishBreak := true breakBar := bar_index } afterBreak = bullishBreak and bar_index > breakBar retestCondition = not useRetest or retestBOS or retestFVG or retestOB structureBullish = not na(lastSwingHigh) and not na(lastSwingLow) and not na(previousSwingLow) and lastSwingLow > previousSwingLow buyCE = structureBullish and bullishBreak and afterBreak and retestCondition and bullishCandle static float entryPrice = na static float stopLoss = na static float tp1 = na static float tp2 = na static bool tradeActive = false if buyCE and not tradeActive { entryPrice := close stopLoss := lastSwingLow float risk = entryPrice - stopLoss if risk > 0 { tp1 := entryPrice + risk * rr1 tp2 := entryPrice + risk * rr2 tradeActive := true } } stopHit = tradeActive and low tp1Hit = tradeActive and high >= tp1 tp2Hit = tradeActive and high >= tp2 if stopHit { tradeActive := false } else if tp2Hit { tradeActive := false } else if tp1Hit { tradeActive := true } plot(showLevels and tradeActive ? entryPrice : na, "Entry", color=color.blue, linewidth=2) plot(showLevels and tradeActive ? stopLoss : na, "Stop Loss", color=color.red, linewidth=2) plot(showLevels and tradeActive ? tp1 : na, "TP1", color=color.orange, linewidth=2) plot(showLevels and tradeActive ? tp2 : na, "TP2", color=color.green, linewidth=2) plotshape(buyCE, "BUY CE", shape=shape.labelup, color=color.green, textcolor=color.white, text="BUY CE", location=location.belowbar) ema21 = talib.ema(close, 21) plot(ema21, "EMA 21", color=color.orange, linewidth=2)

 neutralNIFTY
testing message
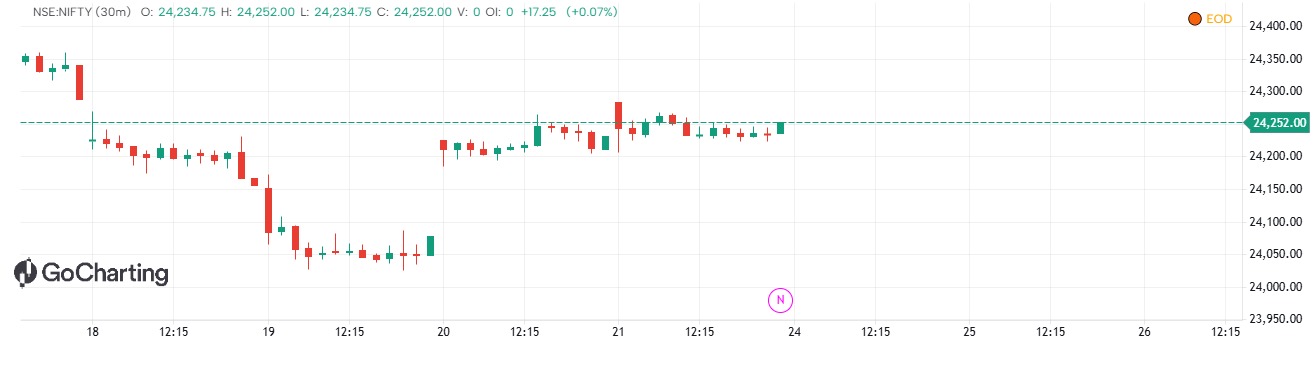
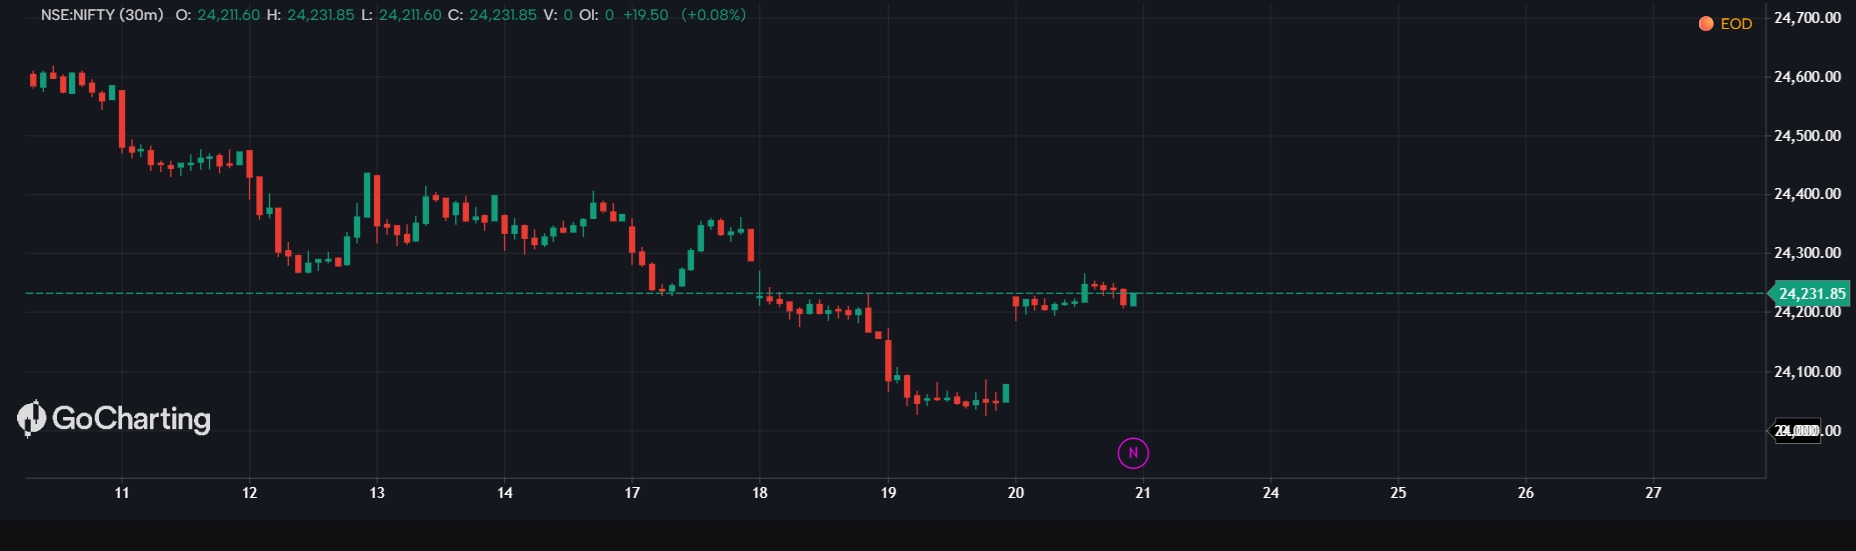
Nifty 50 trades near the 24,150–24,300 zone, showing a short-term consolidation phase. The index faces immediate resistance near 24,340–24,400, with downside support holding near the psychological 24,000–24,100 levels. [1, 2, 3, 4] Key Technical Levels Immediate Resistance: 24,340 and 24,400 Immediate Support: 24,100 and 24,000 Trend Outlook: Range-bound to mildly cautious; a decisive break above 24,400 is required for a stronger upside push, while dropping below 24,000 risks further selling pressure. [1, 2, 3, 4] You can track live charts and order book data directly via the National Stock Exchange of India. [1] If you'd like, let me know: Are you looking at intraday trading or positional/swing analysis? Do you need specific option chain data or strike prices?

 NeutralNIFTY
prince
//@version=6 strategy("SMC - Liquidity Sweep + MSS + FVG", overlay=true, initial_capital=100000, default_qty_type=strategy.percent_of_equity, default_qty_value=1, pyramiding=0, commission_type=strategy.commission.percent, commission_value=0.05, process_orders_on_close=true) //━━━━━━━━━━━━━━━━━━━━━━━━━━━━━━━━━━━━━━━━━━━━━━ // INPUTS //━━━━━━━━━━━━━━━━━━━━━━━━━━━━━━━━━━━━━━━━━━━━━━ swingLen = input.int(5, "Swing Length", minval=2) rr = input.float(2.0, "Risk : Reward", minval=0.5, step=0.5) maxBarsFVG = input.int(10, "Max Bars To Wait For FVG Retest", minval=1) slBufferPct = input.float(0.05, "SL Buffer %", minval=0.0, step=0.01) useLong = input.bool(true, "Enable Longs") useShort = input.bool(true, "Enable Shorts") //━━━━━━━━━━━━━━━━━━━━━━━━━━━━━━━━━━━━━━━━━━━━━━ // SWING LIQUIDITY //━━━━━━━━━━━━━━━━━━━━━━━━━━━━━━━━━━━━━━━━━━━━━━ pivotHigh = ta.pivothigh(high, swingLen, swingLen) pivotLow = ta.pivotlow(low, swingLen, swingLen) var float lastSwingHigh = na var float lastSwingLow = na if not na(pivotHigh) lastSwingHigh := pivotHigh if not na(pivotLow) lastSwingLow := pivotLow //━━━━━━━━━━━━━━━━━━━━━━━━━━━━━━━━━━━━━━━━━━━━━━ // LIQUIDITY SWEEP //━━━━━━━━━━━━━━━━━━━━━━━━━━━━━━━━━━━━━━━━━━━━━━ // Sell-side liquidity sweep: // Price trades below previous swing low, // but closes back above it. sellSideSweep = not na(lastSwingLow) and low close > lastSwingLow // Buy-side liquidity sweep: // Price trades above previous swing high, // but closes back below it. buySideSweep = not na(lastSwingHigh) and high > lastSwingHigh and close //━━━━━━━━━━━━━━━━━━━━━━━━━━━━━━━━━━━━━━━━━━━━━━ // MSS LOGIC //━━━━━━━━━━━━━━━━━━━━━━━━━━━━━━━━━━━━━━━━━━━━━━ // After bullish sweep, price must break recent high. // After bearish sweep, price must break recent low. var float sweepLow = na var float sweepHigh = na var int bullishSweepBar = na var int bearishSweepBar = na if sellSideSweep sweepLow := low bullishSweepBar := bar_index if buySideSweep sweepHigh := high bearishSweepBar := bar_index // Recent structure levels recentHigh = ta.highest(high[1], swingLen) recentLow = ta.lowest(low[1], swingLen) // MSS bullishMSS = not na(bullishSweepBar) and bar_index > bullishSweepBar and close > recentHigh bearishMSS = not na(bearishSweepBar) and bar_index > bearishSweepBar and close //━━━━━━━━━━━━━━━━━━━━━━━━━━━━━━━━━━━━━━━━━━━━━━ // FVG DETECTION //━━━━━━━━━━━━━━━━━━━━━━━━━━━━━━━━━━━━━━━━━━━━━━ // Bullish FVG: // Current candle low > high from 2 candles ago bullishFVG = low > high[2] // Bearish FVG: // Current candle high bearishFVG = high //━━━━━━━━━━━━━━━━━━━━━━━━━━━━━━━━━━━━━━━━━━━━━━ // STORE FVG //━━━━━━━━━━━━━━━━━━━━━━━━━━━━━━━━━━━━━━━━━━━━━━ var float bullFVGTop = na var float bullFVGBottom = na var float bearFVGTop = na var float bearFVGBottom = na var int bullFVGBar = na var int bearFVGBar = na if bullishFVG bullFVGTop := low bullFVGBottom := high[2] bullFVGBar := bar_index if bearishFVG bearFVGTop := low[2] bearFVGBottom := high bearFVGBar := bar_index //━━━━━━━━━━━━━━━━━━━━━━━━━━━━━━━━━━━━━━━━━━━━━━ // VALID FVG RETEST //━━━━━━━━━━━━━━━━━━━━━━━━━━━━━━━━━━━━━━━━━━━━━━ bullFVGValid = not na(bullFVGBar) and bar_index - bullFVGBar bearFVGValid = not na(bearFVGBar) and bar_index - bearFVGBar // FVG midpoint bullFVGmid = (bullFVGTop + bullFVGBottom) / 2 bearFVGmid = (bearFVGTop + bearFVGBottom) / 2 // Price retraces into FVG bullRetest = bullFVGValid and low high >= bullFVGBottom bearRetest = bearFVGValid and high >= bearFVGBottom and low //━━━━━━━━━━━━━━━━━━━━━━━━━━━━━━━━━━━━━━━━━━━━━━ // ENTRY CONDITIONS //━━━━━━━━━━━━━━━━━━━━━━━━━━━━━━━━━━━━━━━━━━━━━━ // Long sequence: // // Sell-side liquidity sweep // ↓ // Bullish MSS // ↓ // Bullish FVG // ↓ // FVG retracement // ↓ // BUY longSetup = useLong and bullishMSS and bullFVGValid and bullRetest // Short sequence: // // Buy-side liquidity sweep // ↓ // Bearish MSS // ↓ // Bearish FVG // ↓ // FVG retracement // ↓ // SELL shortSetup = useShort and bearishMSS and bearFVGValid and bearRetest //━━━━━━━━━━━━━━━━━━━━━━━━━━━━━━━━━━━━━━━━━━━━━━ // TRADE VARIABLES //━━━━━━━━━━━━━━━━━━━━━━━━━━━━━━━━━━━━━━━━━━━━━━ var float longSL = na var float longTP = na var float shortSL = na var float shortTP = na //━━━━━━━━━━━━━━━━━━━━━━━━━━━━━━━━━━━━━━━━━━━━━━ // LONG ENTRY //━━━━━━━━━━━━━━━━━━━━━━━━━━━━━━━━━━━━━━━━━━━━━━ if longSetup and strategy.position_size == 0 entryPrice = bullFVGmid sl = sweepLow * (1 - slBufferPct / 100) risk = entryPrice - sl if risk > syminfo.mintick tp = entryPrice + risk * rr longSL := sl longTP := tp strategy.entry( "LONG", strategy.long, limit=entryPrice) //━━━━━━━━━━━━━━━━━━━━━━━━━━━━━━━━━━━━━━━━━━━━━━ // SHORT ENTRY //━━━━━━━━━━━━━━━━━━━━━━━━━━━━━━━━━━━━━━━━━━━━━━ if shortSetup and strategy.position_size == 0 entryPrice = bearFVGmid sl = sweepHigh * (1 + slBufferPct / 100) risk = sl - entryPrice if risk > syminfo.mintick tp = entryPrice - risk * rr shortSL := sl shortTP := tp strategy.entry( "SHORT", strategy.short, limit=entryPrice) //━━━━━━━━━━━━━━━━━━━━━━━━━━━━━━━━━━━━━━━━━━━━━━ // EXIT //━━━━━━━━━━━━━━━━━━━━━━━━━━━━━━━━━━━━━━━━━━━━━━ if strategy.position_size > 0 strategy.exit( "LONG EXIT", "LONG", stop=longSL, limit=longTP) if strategy.position_size strategy.exit( "SHORT EXIT", "SHORT", stop=shortSL, limit=shortTP) //━━━━━━━━━━━━━━━━━━━━━━━━━━━━━━━━━━━━━━━━━━━━━━ // VISUAL MARKERS //━━━━━━━━━━━━━━━━━━━━━━━━━━━━━━━━━━━━━━━━━━━━━━ plot(lastSwingHigh, "Buy-side Liquidity", color=color.red, style=plot.style_linebr) plot(lastSwingLow, "Sell-side Liquidity", color=color.green, style=plot.style_linebr) plotshape( sellSideSweep, title="Sell-side Sweep", style=shape.triangleup, location=location.belowbar, color=color.green, size=size.tiny, text="SSL") plotshape( buySideSweep, title="Buy-side Sweep", style=shape.triangledown, location=location.abovebar, color=color.red, size=size.tiny, text="BSL") plotshape( bullishMSS, title="Bullish MSS", style=shape.labelup, location=location.belowbar, color=color.green, text="MSS↑") plotshape( bearishMSS, title="Bearish MSS", style=shape.labeldown, location=location.abovebar, color=color.red, text="MSS↓") plotshape( longSetup, title="Long Setup", style=shape.labelup, location=location.belowbar, color=color.green, text="BUY") plotshape( shortSetup, title="Short Setup", style=shape.labeldown, location=location.abovebar, color=color.red, text="SELL")

 neutralBTCUSDT
BTCUSDT 30m: three checks before you trust a breakout
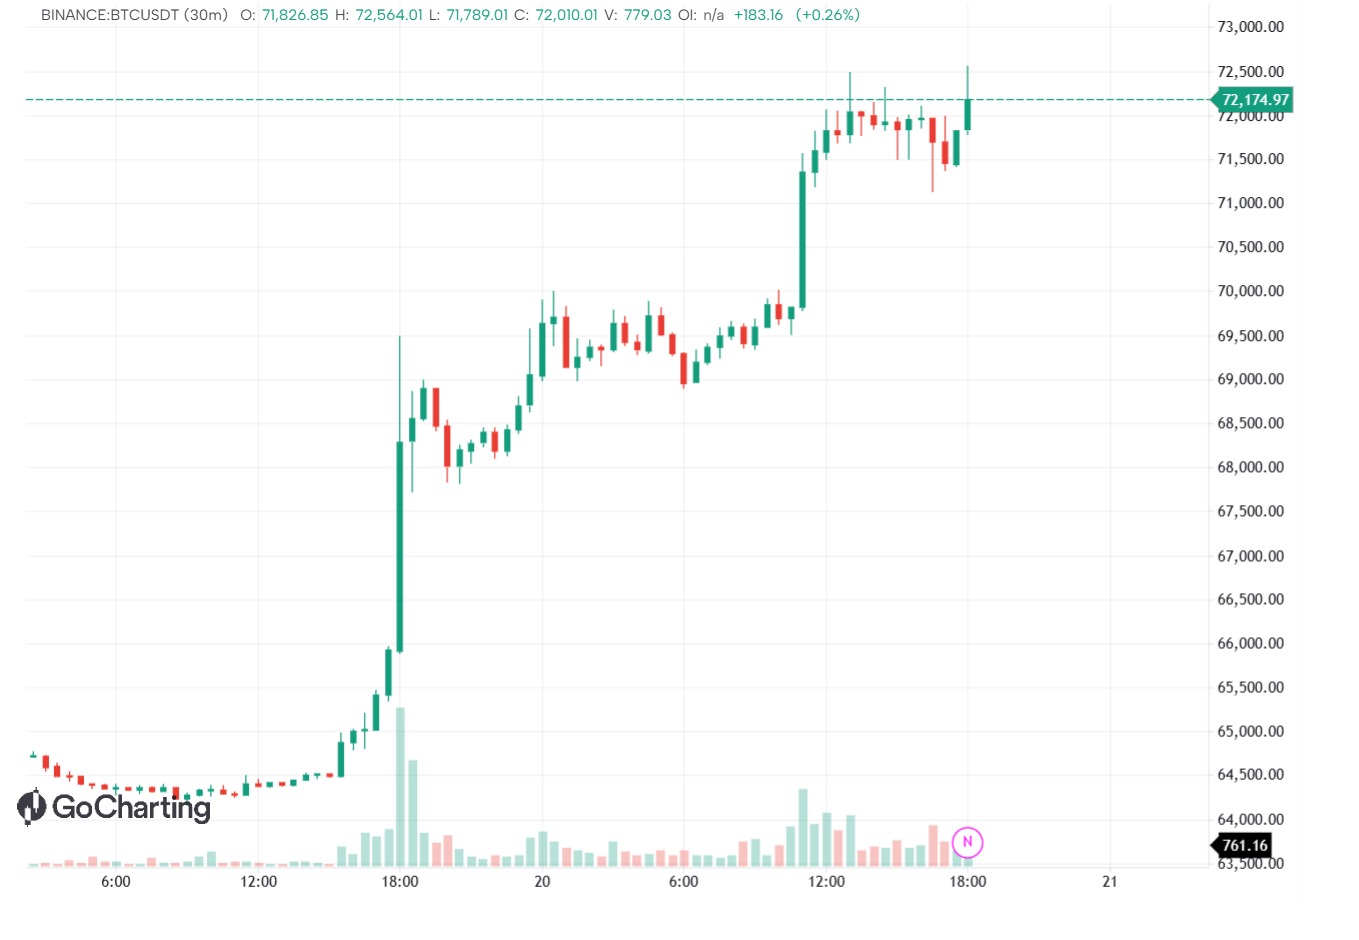
BTCUSDT pushed through the 72,000 area after a sharp impulse off 64,500. The useful question is not the direction, it is whether the move has anything behind it. 1. Volume confirms the impulse. A working move usually prints volume above the 20-bar average. Price tearing through a level on unremarkable volume is more often a stop hunt than the start of a trend. 2. Speed matters more than size. Count the bars, not the candle length. Five fast bars with short wicks is an impulse. Ten bars with long wicks in both directions is distribution, and price often leaves that zone the other way. 3. The retest has to respect the level. After a real impulse price comes back to the broken level and bounces from it. If the pullback eats more than two thirds of the move and closes on the far side, there was no impulse - there was a sweep. Invalidation first: a scenario without a price at which the idea stops working is not a scenario. Here that price is a 30m close back under 71,000. Not investment advice. Every trade carries risk. Team Midas - open market breakdowns and TradingView indicators: midas-club.com

binicular

 XAUUSD
XAUUSD ANALISE FIM DO DIA
Este material é disponibilizado exclusivamente com o propósito de educação. É fundamental compreender que não assumimos qualquer responsabilidade por quaisquer consequências ou resultados que possam advir da sua utilização. Salientamos que não oferecemos, em nenhuma circunstância, aconselhamento financeiro personalizado ou análises de investimento detalhadas. O conteúdo aqui presente não deve ser interpretado como uma recomendação para realizar quaisquer tipos de transações financeiras ou tomar decisões de investimento específicas. O objetivo primordial é apenas fornecer informações para fins de aprendizagem e compreensão geral de conceitos, sem qualquer intenção de guiar ou influenciar decisões de caráter financeiro individual.

 neutral
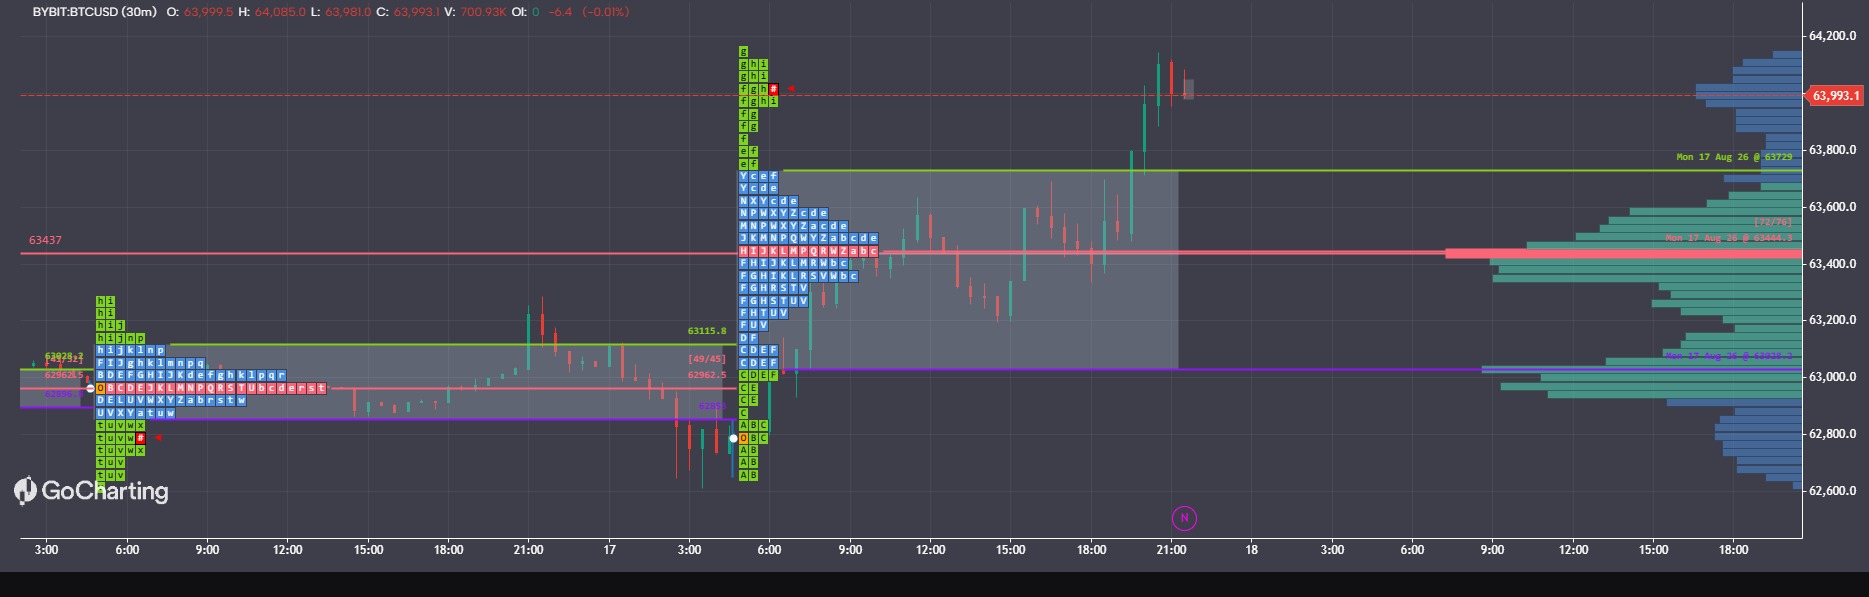
 BTCUSD
cxvxc
Candle Entering in a Bullish Order Block", "Candle Entering in a Bullish Order Block

 NIFTY
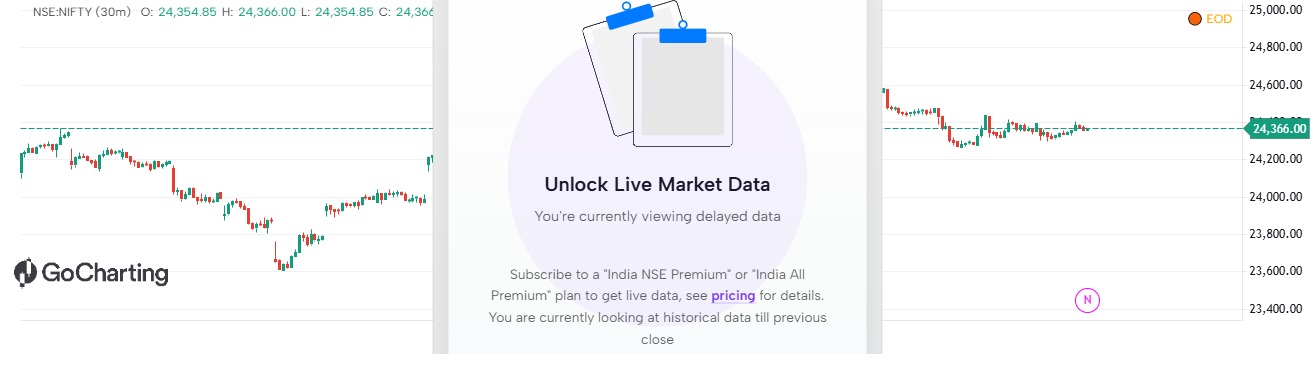
NIFTYRange ank

 neutralUNIUSDC
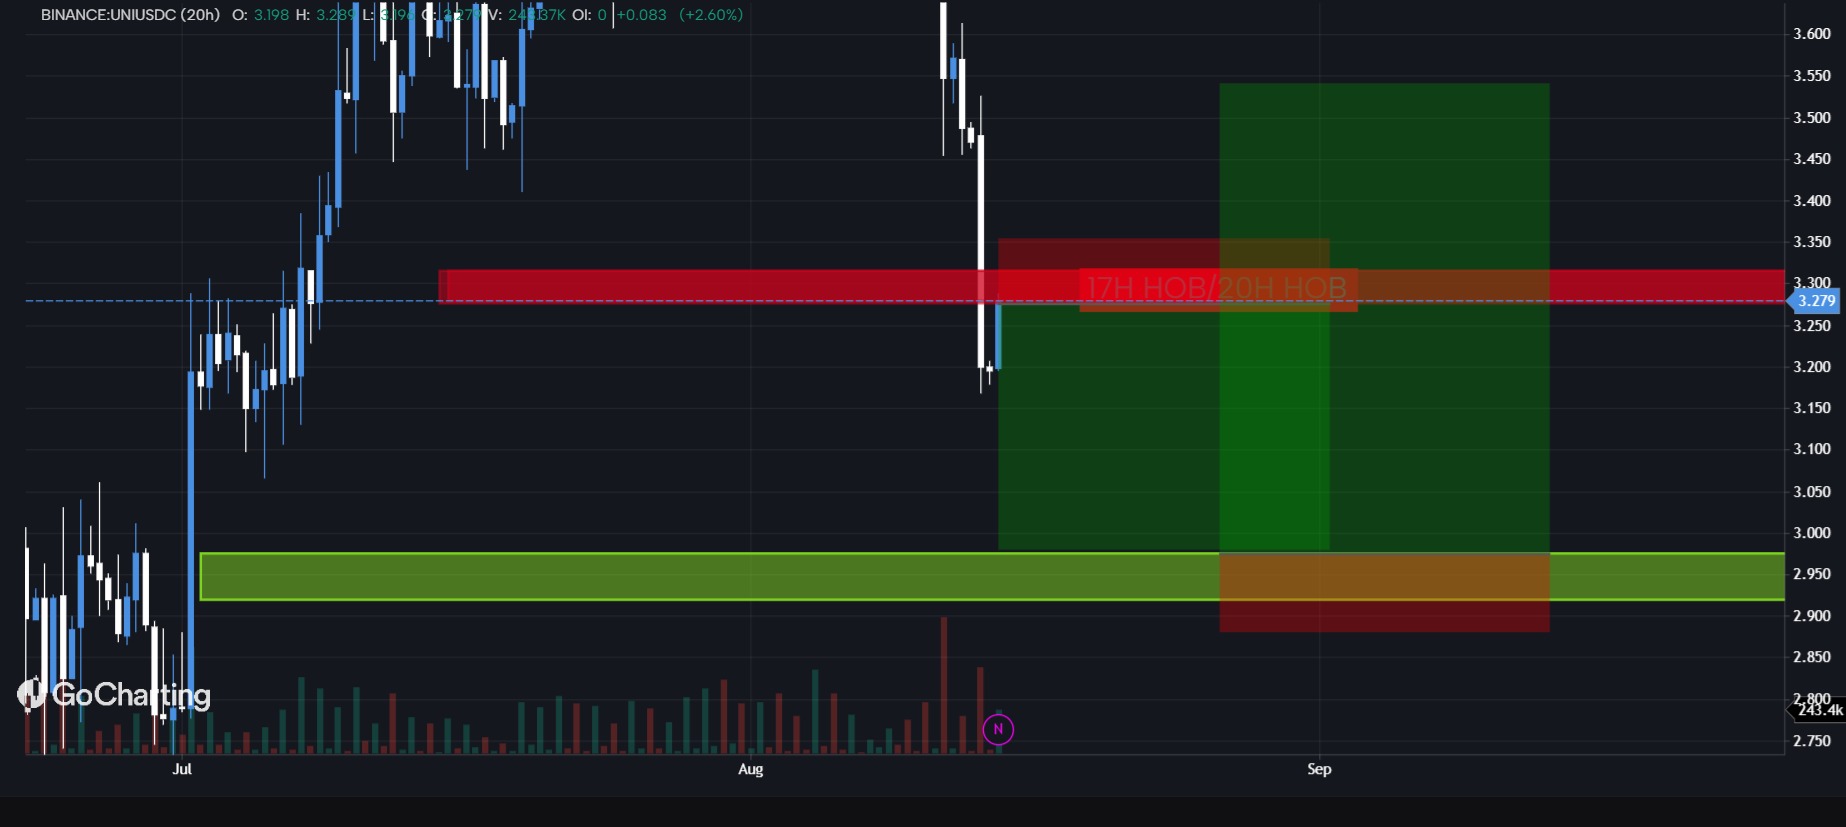
Uni plan
short and long manage rn.............................................................................................................................................................
