
Lipi — GoCharting's
Scripting Engine
Write custom indicators, strategy automations and data visualisations directly on the chart. Native access to orderflow metrics, COT data and a community of 7,000+ shared scripts.
Lipi is a powerful and flexible scripting language built directly into GoCharting. With access to orderflow metrics, COT data and a thriving community library, Lipi is the most capable scripting engine available in any web-based trading platform. No installs, no plugins — just open the Script Editor and start coding.
What You Can Build
Key Features
- ✓ Full API documentation with examples and code snippets
- ✓ Indicator-on-indicator support — chain multiple scripts together
- ✓ Plot shapes, labels, lines, filled areas and backgrounds from code
- ✓ Alert conditions defined in script — fires on chart or via notification
- ✓ Save and share scripts from the cloud — works across all devices
- ✓ Community support, self-help videos and guided tutorials
Learn & Reference
Community Scripts Showcase
Explore MoreDiscover what traders have built with Lipi. Browse all 7,000+ scripts
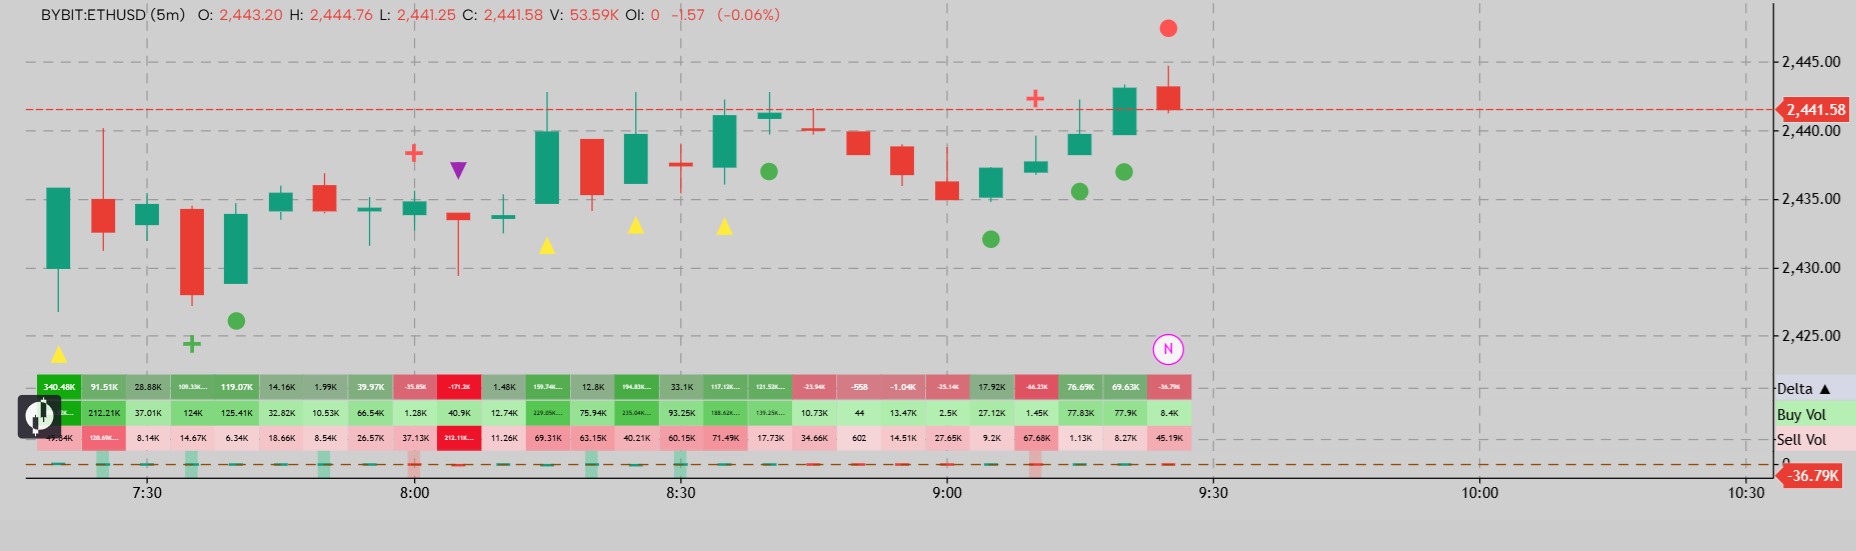
Highlighting of strong buyer and seller candles based on the strength of the opposing volume within each candle. The purpose is to identify candles where one side clearly dominates despite the presence of opposite-side trading activity. A strong buyer candle is identified by evaluating the buy volume relative to the sell volume within the same candle, while a strong seller candle is identified by comparing the sell volume against the corresponding buy volume. This helps distinguish genuinely dominant buying or selling pressure from candles where the volume is more balanced between both sides.
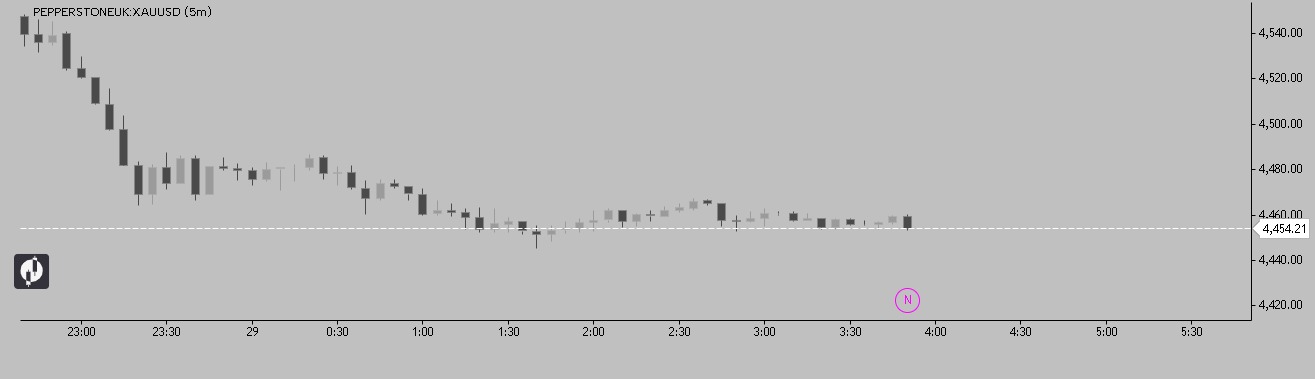
momentum candle by rizki aditama sekolah trading .............................................................................................
momentum candle adalah suastu candle besar dengan ekor kecil
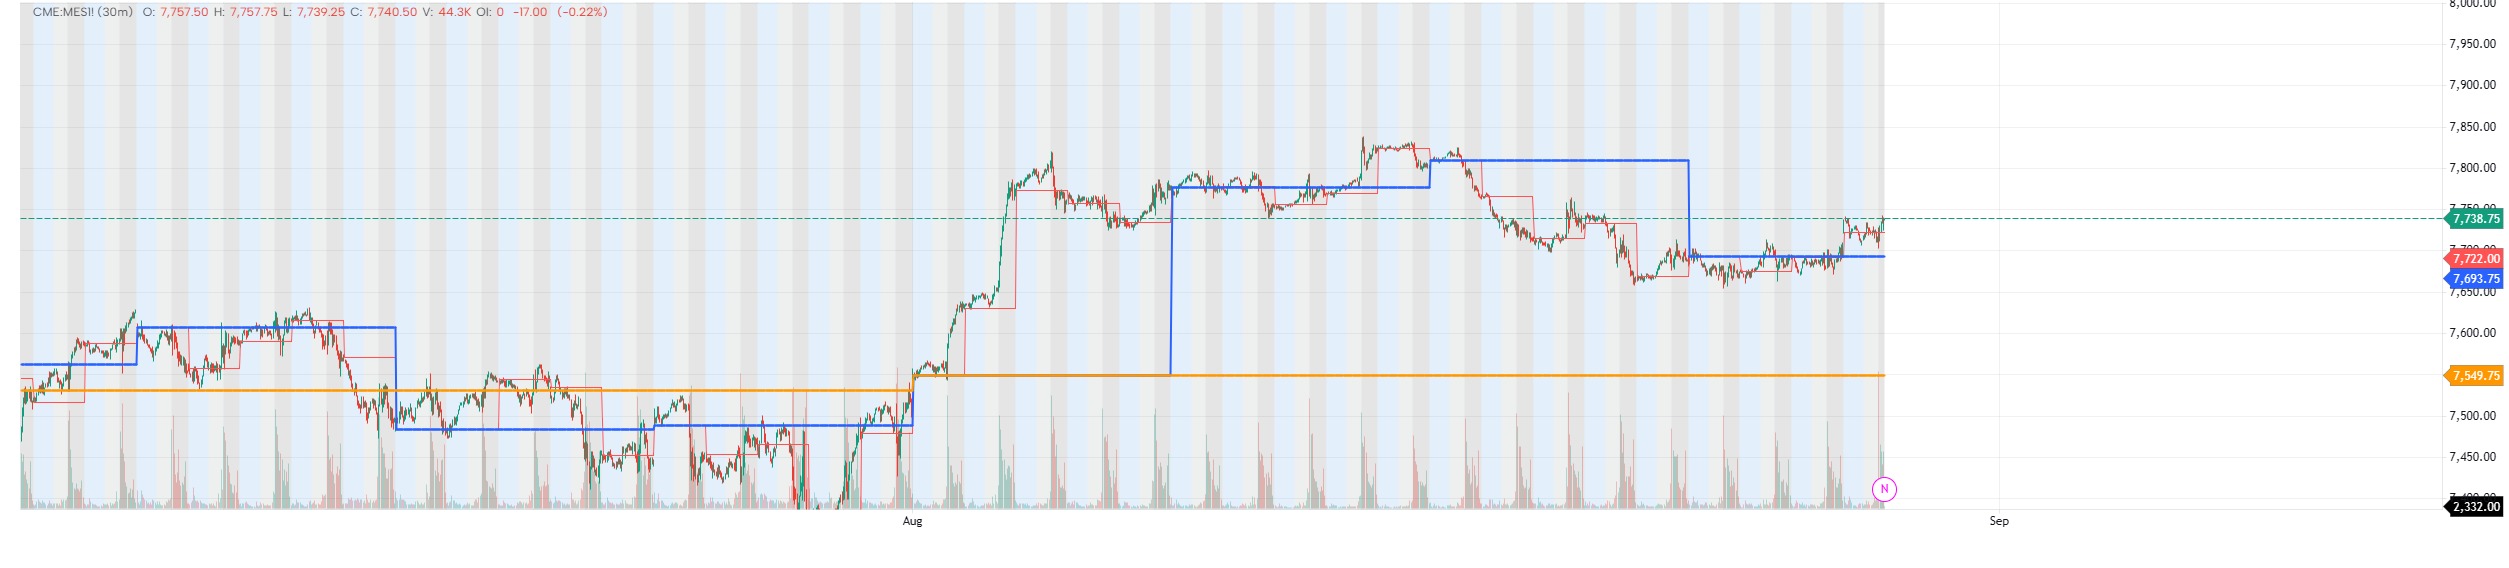
Daily • Weekly • Monthly Opens
Markets do not begin at random. Every new day, week and month starts a fresh auction. In Auction Market Theory the open is not decoration. It is the start of price discovery for that timeframe. An open inside prior value often precedes rotation. An open outside prior value with conviction often precedes imbalance. Alignment across monthly, weekly and daily opens raises probability. Conflict between them warns you that you may be trading a counter-move inside a larger auction.
This indicator plots the levels institutions actually use as reference: the Daily Open, Weekly Open and Monthly Open. Price is measured against these anchors so you can see, at a glance, whether the current auction is trading in premium or discount — and whether higher-timeframe structure supports or contradicts the move in front of you.
What it shows
Daily, Weekly and Monthly Opens as persistent reference lines
Optional True Opens
Live premium / discount state relative to each open
Clean, uncluttered overlay that stays readable on lower timeframes
Usage
Use the Monthly Open for swing bias.
Use the Weekly Open for the week’s draw.
Use the Daily Open for session execution.
One framework. Three timeframes.
Use in conjunction with Market Profile indicator for value areas.
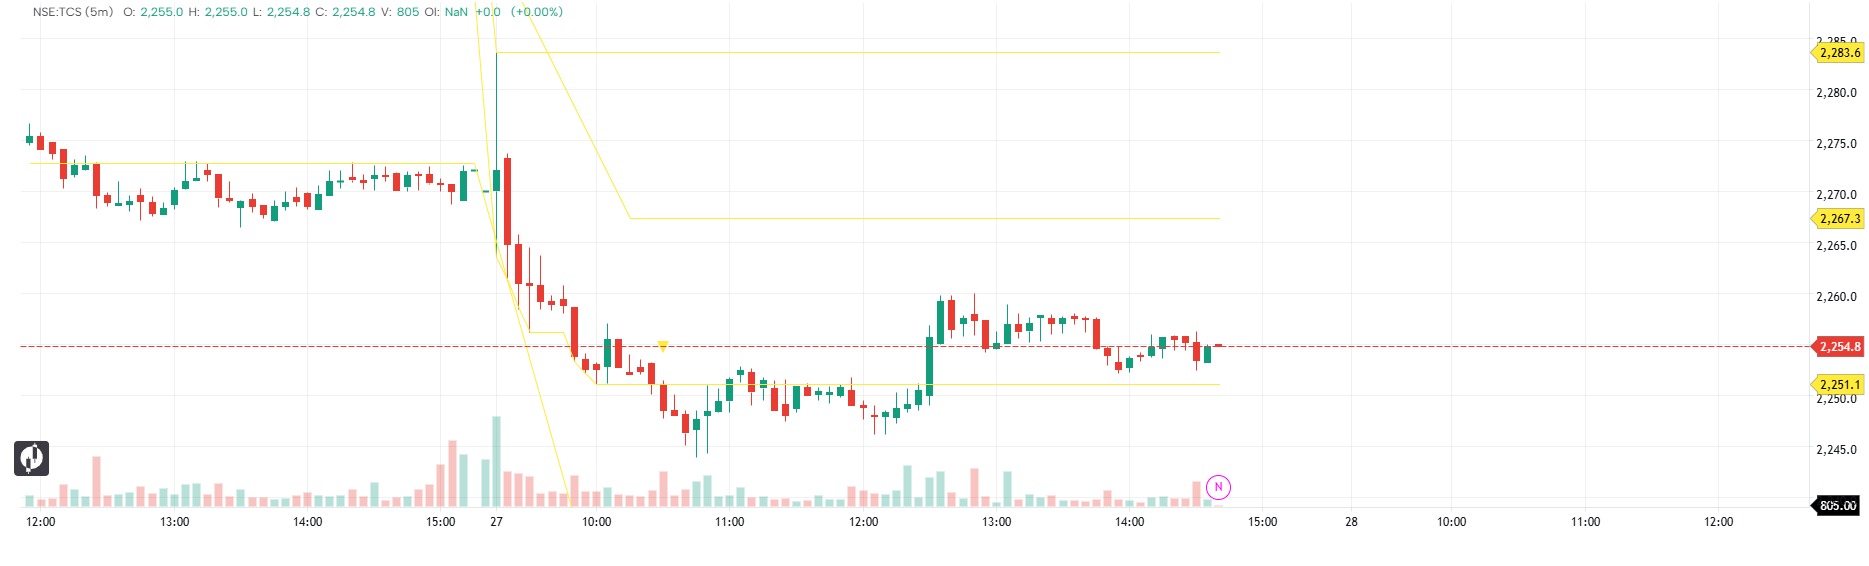
Initial Balance for NSE intraday charts.
Default window is 09:15-10:15 IST (first 60 minutes of the regular session).
Tracks the running high/low inside the window, locks them when it closes, then plots the midpoint and range extensions for the rest of the session.
hour and minute follow the CHART timezone, not the exchange. If the chart is not on Asia/Kolkata, change the start hour/minute inputs, not the code.
Use an interval that divides the window evenly: 1, 3, 5, 15 or 30 minutes.
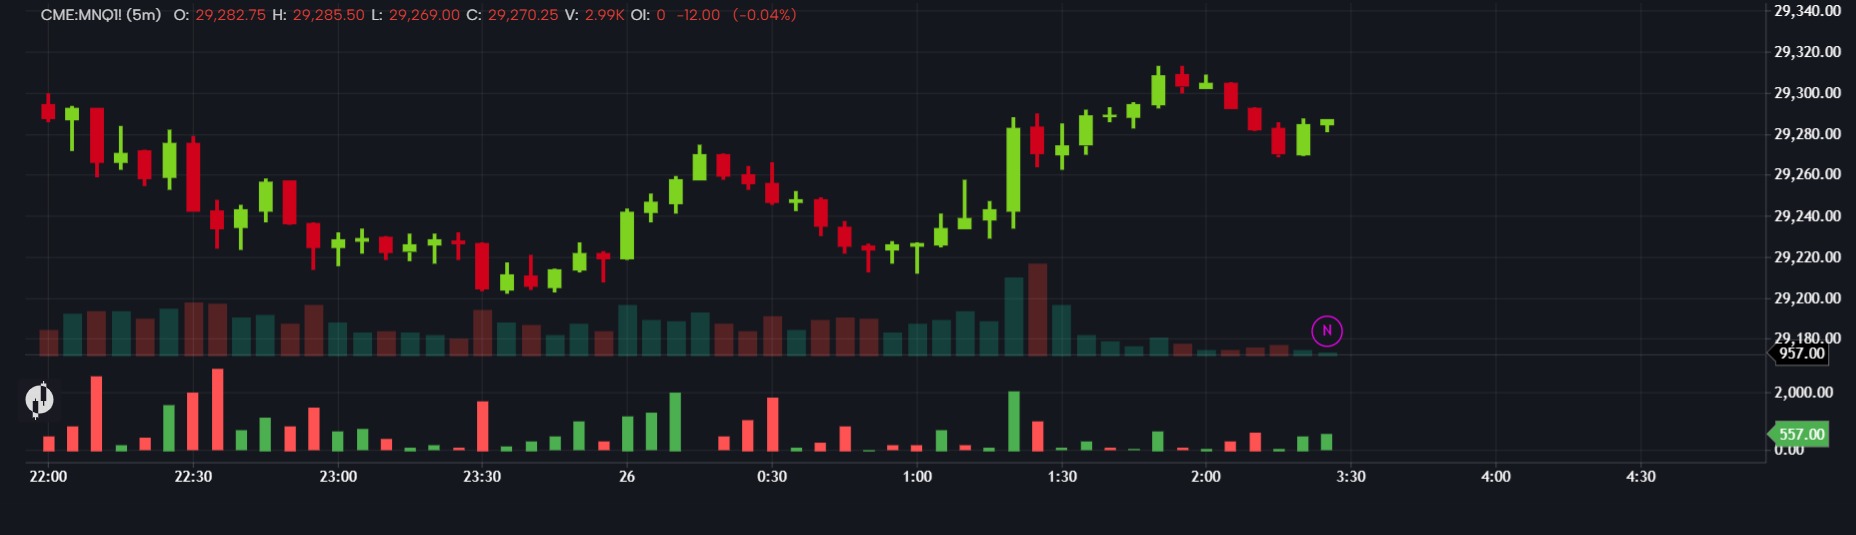
GomDeltaMomentum is an order-flow momentum indicator designed to track consecutive buying and selling pressure across price bars.
Key Features
Directional Accumulation: Continuously adds volume delta (Market Buys − Market Sells) as long as incoming order flow remains in the same direction, building a visual wave of sustained market pressure.
Instant Reset on Flips: Resets the accumulation to the current bar's delta as soon as opposing order flow takes over, making trend shifts and exhaustion easy to spot.
Histogram Visualization: Displays the absolute strength of accumulated pressure as a clear bar chart below price, color-coded in green (net buying streak) and red (net selling streak).
How to Use
Rising Green/Red Bars: Indicate strong, uninterrupted buying or selling conviction.
Sudden Drop in Bar Height / Color Change: Signals that opposing order flow has interrupted the streak, indicating a potential momentum pause or reversal.
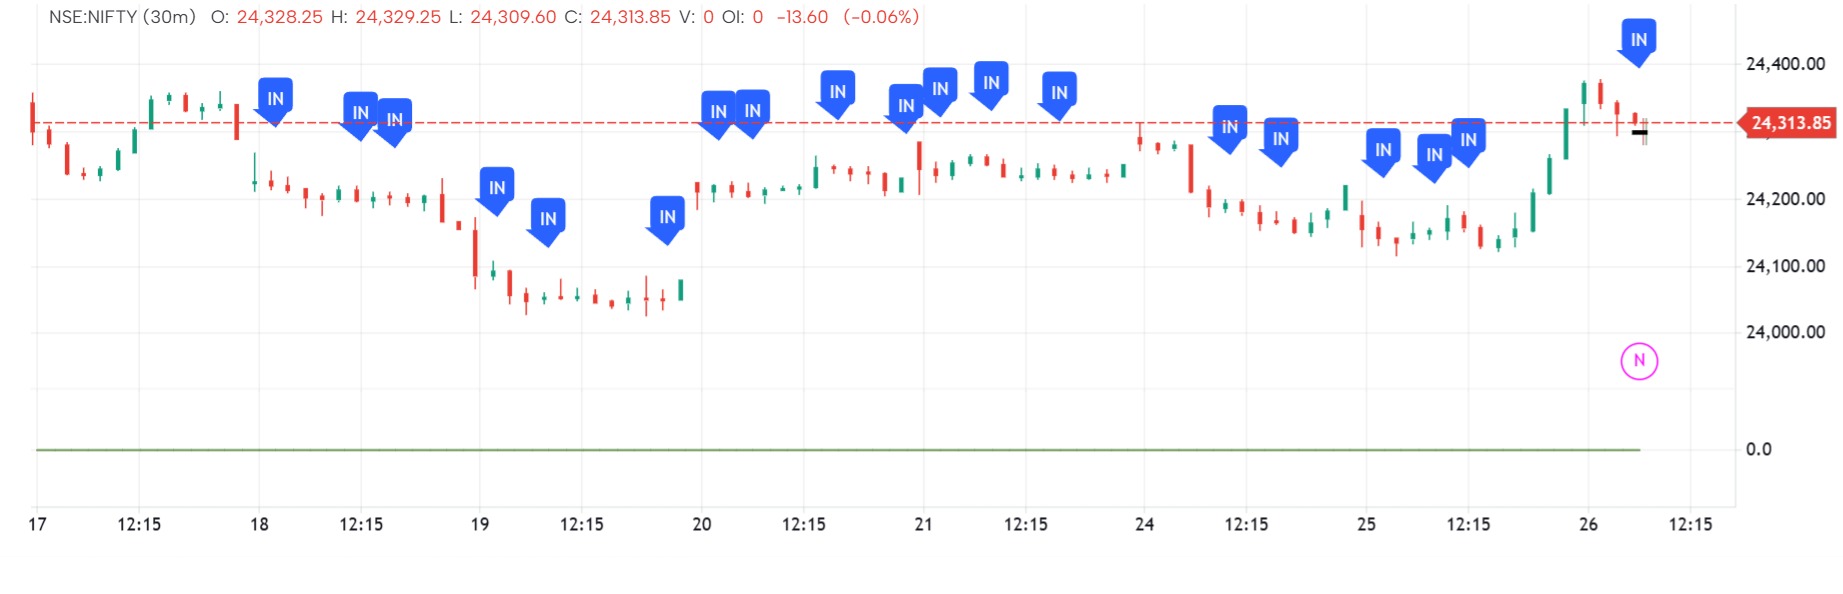
VOLUME CROSS OVER ALERT — Indicator Analysis
The VOLUME CROSS OVER ALERT indicator is designed to identify unusually strong volume activity by detecting when the current volume moves above a predefined statistical threshold.
Volume is one of the most useful tools for understanding the level of participation behind a price move. A significant increase in volume can indicate that a larger number of market participants are becoming active and that the current price movement may deserve closer attention.
What the Indicator Does
The indicator monitors the volume of the selected timeframe and generates an alert when volume crosses above the upper statistical threshold.
The threshold is based on the recent behaviour of volume, allowing the indicator to identify volume activity that is unusually high relative to its recent history.
This makes it particularly useful for spotting volume expansion without requiring the trader to continuously monitor the volume bars manually.
Why Volume Expansion Matters
A sudden increase in volume can occur when there is a significant change in market participation.
High-volume events may accompany:
Breakouts from important price levels
Strong trend continuation
Reversals
News or event-driven moves
Institutional participation
Panic buying or selling
The beginning of a volatility expansion
However, high volume by itself does not determine whether the market will move higher or lower. Volume measures participation, not direction.
How to Interpret the Alert
When the alert is triggered, the key question is not simply “Is volume high?” but rather:
“What is price doing while this unusual volume is occurring?”
For example:
High Volume + Breakout
If volume expands as price breaks above a well-defined resistance level, the increased participation may add significance to the breakout.
High Volume + Breakdown
If unusually high volume accompanies a break below support, it may indicate strong selling participation.
High Volume + Large Range
When exceptional volume occurs together with an unusually large price range, it can indicate a significant expansion in market activity.
High Volume + Little Price Movement
High volume without substantial price movement can also be important. It may indicate intense buying and selling activity occurring around an important price level.
Alert-Based Approach
One of the main advantages of the indicator is that it is designed around an alert rather than simply a visual volume study.
Instead of constantly watching the chart and waiting for an unusually large volume bar, the trader can use the alert to bring attention to the event when it occurs.
This is particularly useful when monitoring multiple instruments or higher timeframes where important volume events may occur infrequently.
Timeframe Flexibility
The significance of volume is relative to the timeframe being analysed.
A volume expansion on a 15-minute chart, for example, represents unusual participation during that intraday period. The same concept can be applied to other timeframes depending on the trader's strategy.
For meaningful interpretation, the volume threshold should always be considered in the context of the selected timeframe and instrument.
Important Consideration
A volume alert is not a standalone buy or sell signal.
Unusually high volume can occur at both the beginning and the end of a move. It can represent accumulation, distribution, breakout participation, panic, or simply event-driven activity.
The alert is therefore best used as a market-attention tool that tells the trader:
Something unusual is happening in volume — investigate the price action.
Key Takeaway
The VOLUME CROSS OVER ALERT indicator helps traders identify statistically unusual volume expansion without having to constantly monitor volume bars.
By drawing attention to volume crossing above its upper threshold, the indicator can help traders spot potential breakouts, reversals, trend acceleration, volatility expansion, and significant market participation.
Use the alert as a trigger for further analysis, and always combine volume information with price structure, trend, support and resistance, and subsequent price action before making a trading decision.
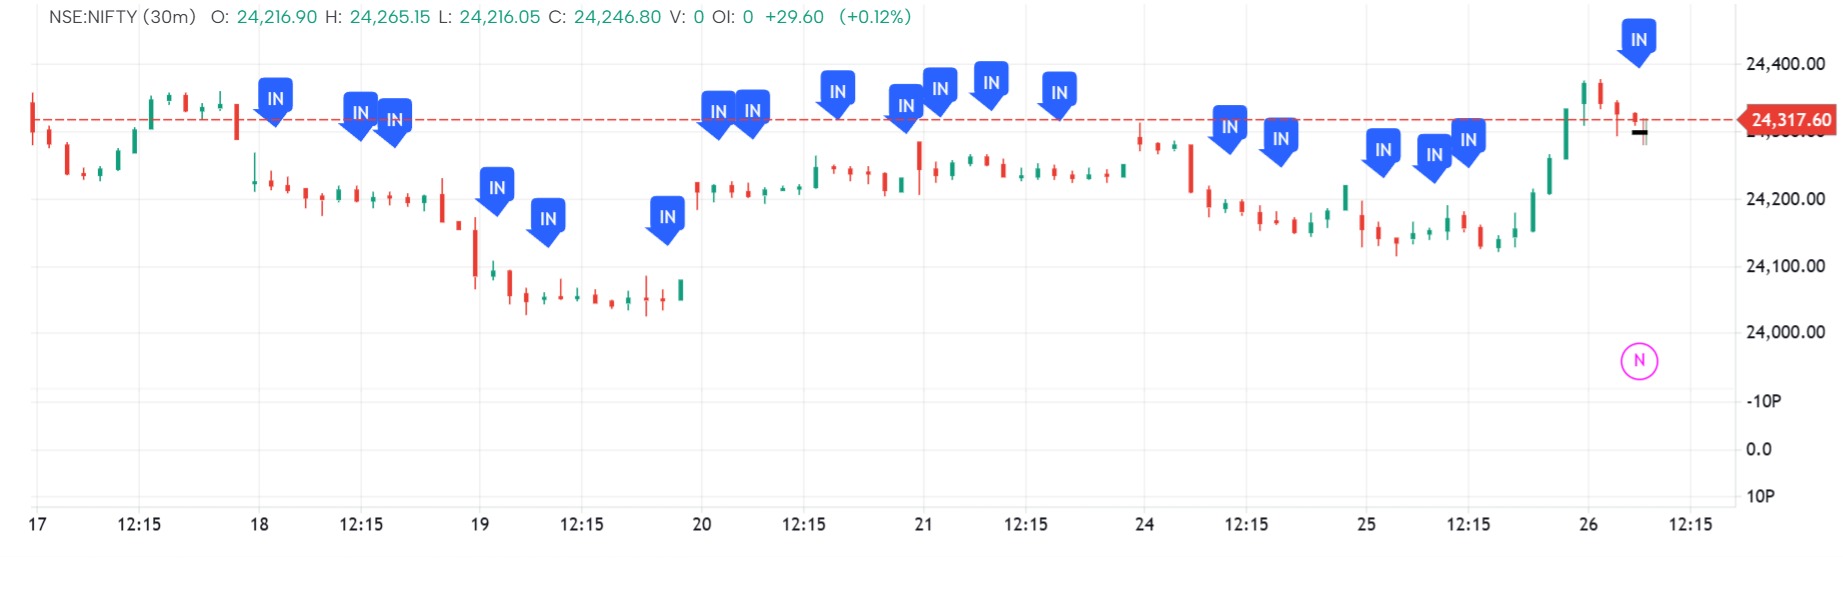
INSIDE DAY — Indicator Analysis
The INSIDE DAY indicator identifies a classic price-action pattern in which the entire trading range of the current day is contained within the previous day’s range.
An Inside Day occurs when:
Current Day High ≤ Previous Day High
Current Day Low ≥ Previous Day Low
This indicates a period of contraction and consolidation, where price is temporarily trading within the boundaries established by the previous session.
Why Inside Days Matter
An Inside Day represents a potential pause in price expansion. After a larger directional move, the market may temporarily compress as buyers and sellers reach a short-term equilibrium.
This compression can be significant because periods of reduced range are often followed by an expansion in volatility. Traders therefore commonly watch the high and low of the Inside Day as potential breakout reference levels.
The pattern itself does not indicate the direction of the eventual breakout. The subsequent price action determines whether the market resolves higher or lower.
How This Indicator Works
The INSIDE DAY indicator automatically compares each day's high and low with the previous day's trading range.
When the current day's complete range falls within the previous day's range, the indicator identifies that candle and annotates it with “IN” near the candle.
This allows traders to quickly scan a daily chart and identify historical and current Inside Day formations without manually comparing consecutive candles.
How to Use It
The indicator can be used as a market-structure and volatility-compression tool.
After an Inside Day is identified, traders may monitor:
Break above the Inside Day high — potential bullish resolution.
Break below the Inside Day low — potential bearish resolution.
Continued consolidation — the market may remain compressed before a later expansion.
The signal should ideally be interpreted alongside the broader market trend, support and resistance levels, volume, and other forms of price-action analysis.
Important Consideration
An Inside Day is a setup, not a trade signal by itself.
A breakout can fail, and the market can remain inside the range for several sessions. Traders should therefore avoid assuming that every Inside Day will lead to an immediate directional move.
The indicator is designed primarily to make the pattern easy to identify and study on the daily chart.
Key Takeaway
The INSIDE DAY indicator provides a simple visual way to identify daily range contraction. By highlighting days whose trading range is contained within the previous day's range, it helps traders recognize periods of compression that may precede a volatility expansion.
Use the “IN” annotation as a point of attention and combine it with subsequent price action to determine whether the market is developing a meaningful breakout opportunity.
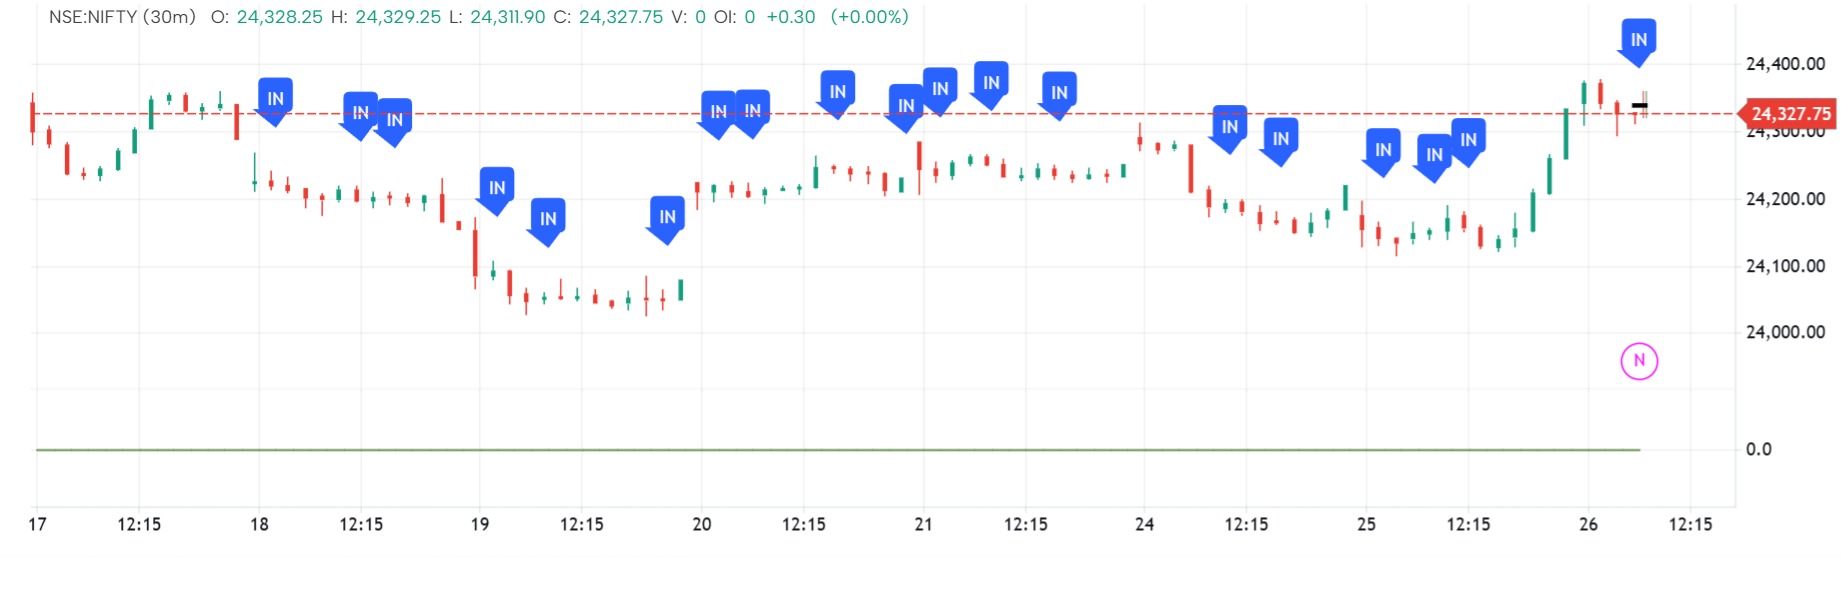
INSIDE DAY — Indicator Analysis
The INSIDE DAY indicator identifies a classic price-action pattern in which the entire trading range of the current day is contained within the previous day’s range.
An Inside Day occurs when:
Current Day High ≤ Previous Day High
Current Day Low ≥ Previous Day Low
This indicates a period of contraction and consolidation, where price is temporarily trading within the boundaries established by the previous session.
Why Inside Days Matter
An Inside Day represents a potential pause in price expansion. After a larger directional move, the market may temporarily compress as buyers and sellers reach a short-term equilibrium.
This compression can be significant because periods of reduced range are often followed by an expansion in volatility. Traders therefore commonly watch the high and low of the Inside Day as potential breakout reference levels.
The pattern itself does not indicate the direction of the eventual breakout. The subsequent price action determines whether the market resolves higher or lower.
How This Indicator Works
The INSIDE DAY indicator automatically compares each day's high and low with the previous day's trading range.
When the current day's complete range falls within the previous day's range, the indicator identifies that candle and annotates it with “IN” near the candle.
This allows traders to quickly scan a daily chart and identify historical and current Inside Day formations without manually comparing consecutive candles.
How to Use It
The indicator can be used as a market-structure and volatility-compression tool.
After an Inside Day is identified, traders may monitor:
Break above the Inside Day high — potential bullish resolution.
Break below the Inside Day low — potential bearish resolution.
Continued consolidation — the market may remain compressed before a later expansion.
The signal should ideally be interpreted alongside the broader market trend, support and resistance levels, volume, and other forms of price-action analysis.
Important Consideration
An Inside Day is a setup, not a trade signal by itself.
A breakout can fail, and the market can remain inside the range for several sessions. Traders should therefore avoid assuming that every Inside Day will lead to an immediate directional move.
The indicator is designed primarily to make the pattern easy to identify and study on the daily chart.
Key Takeaway
The INSIDE DAY indicator provides a simple visual way to identify daily range contraction. By highlighting days whose trading range is contained within the previous day's range, it helps traders recognize periods of compression that may precede a volatility expansion.
Use the “IN” annotation as a point of attention and combine it with subsequent price action to determine whether the market is developing a meaningful breakout opportunity.
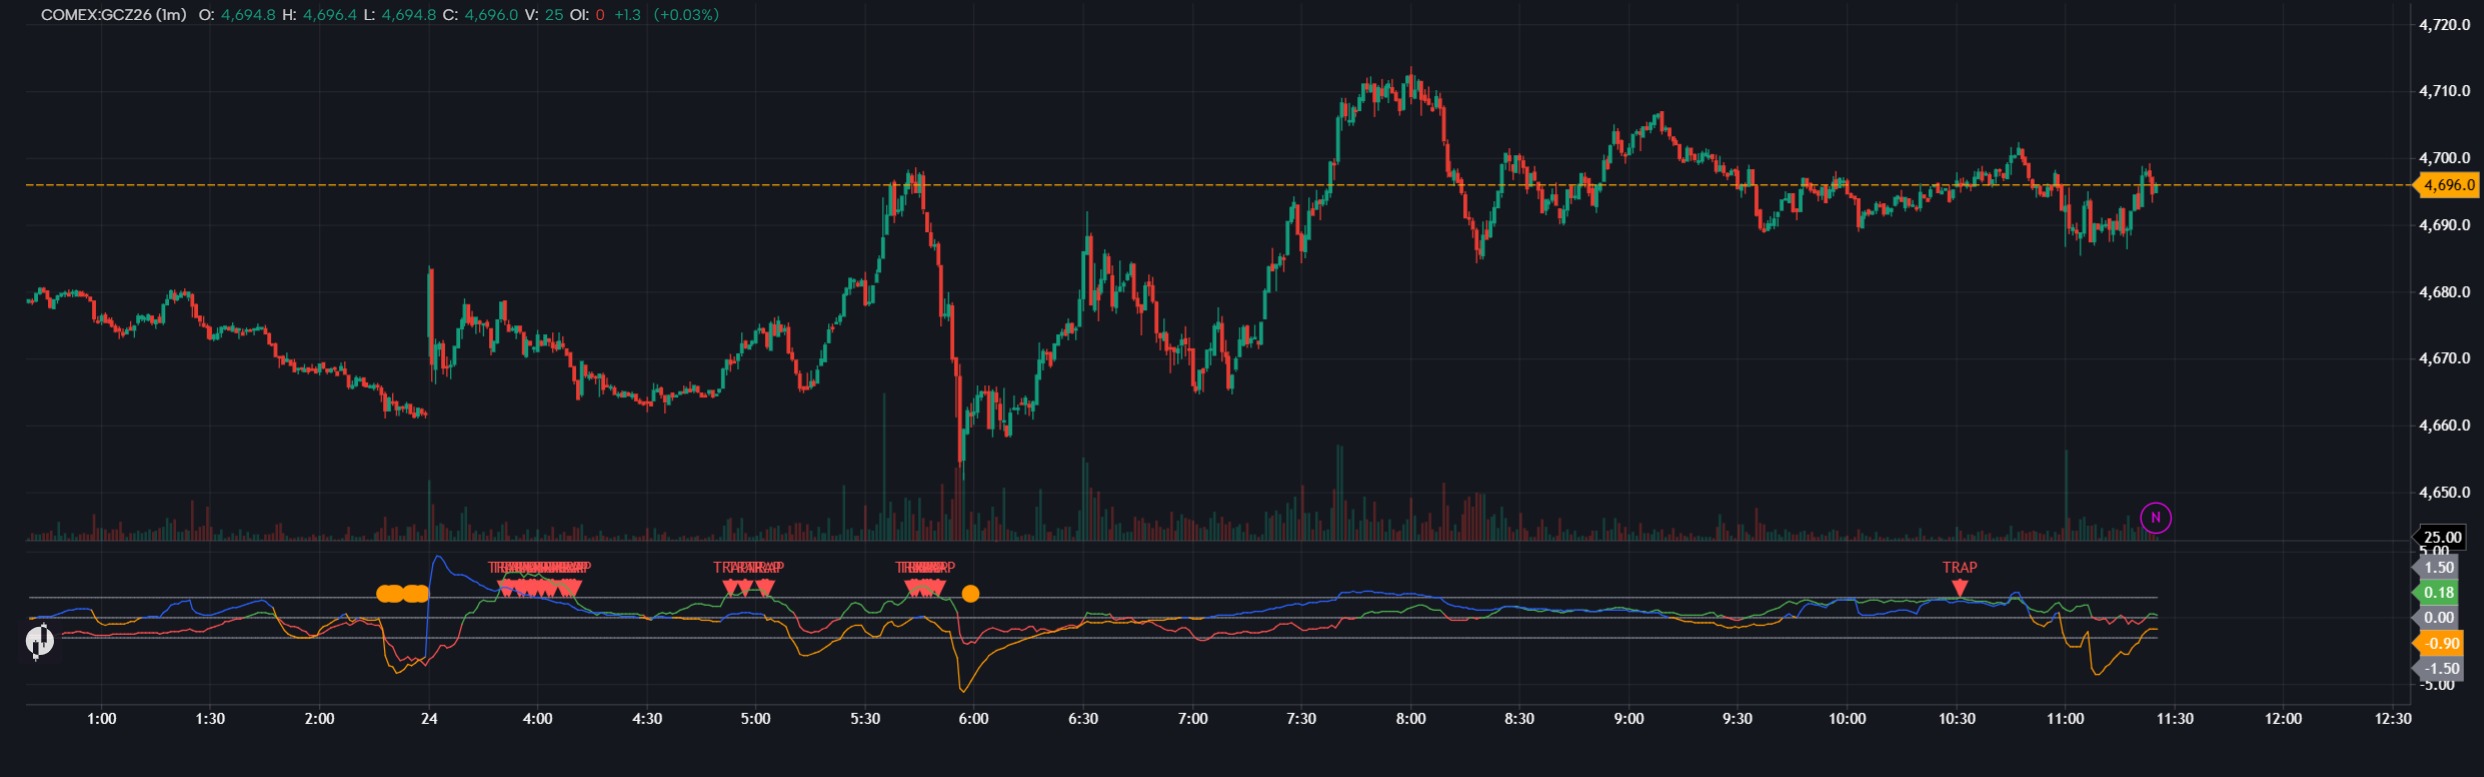
Adaptive CVD: Tracks buying vs. selling pressure and automatically adapts to changing market volatility.Order Flow + Price: Checks whether price movement is supported by actual buying/selling pressure.
Absorption Detection: Highlights situations where aggressive buying/selling is being absorbed by the opposite side.
Breakout & Breakdown Signals: Identifies strong directional moves when CVD, efficiency, and price all agree.
Trap Detection: Flags potential buying traps and selling traps when order flow strongly disagrees with price.
Normalized Signals: Uses Z-scores to make the readings more consistent across different market conditions.
Visual Output: Shows Adaptive CVD + Directional Efficiency along with clear bullish/bearish signal markers.
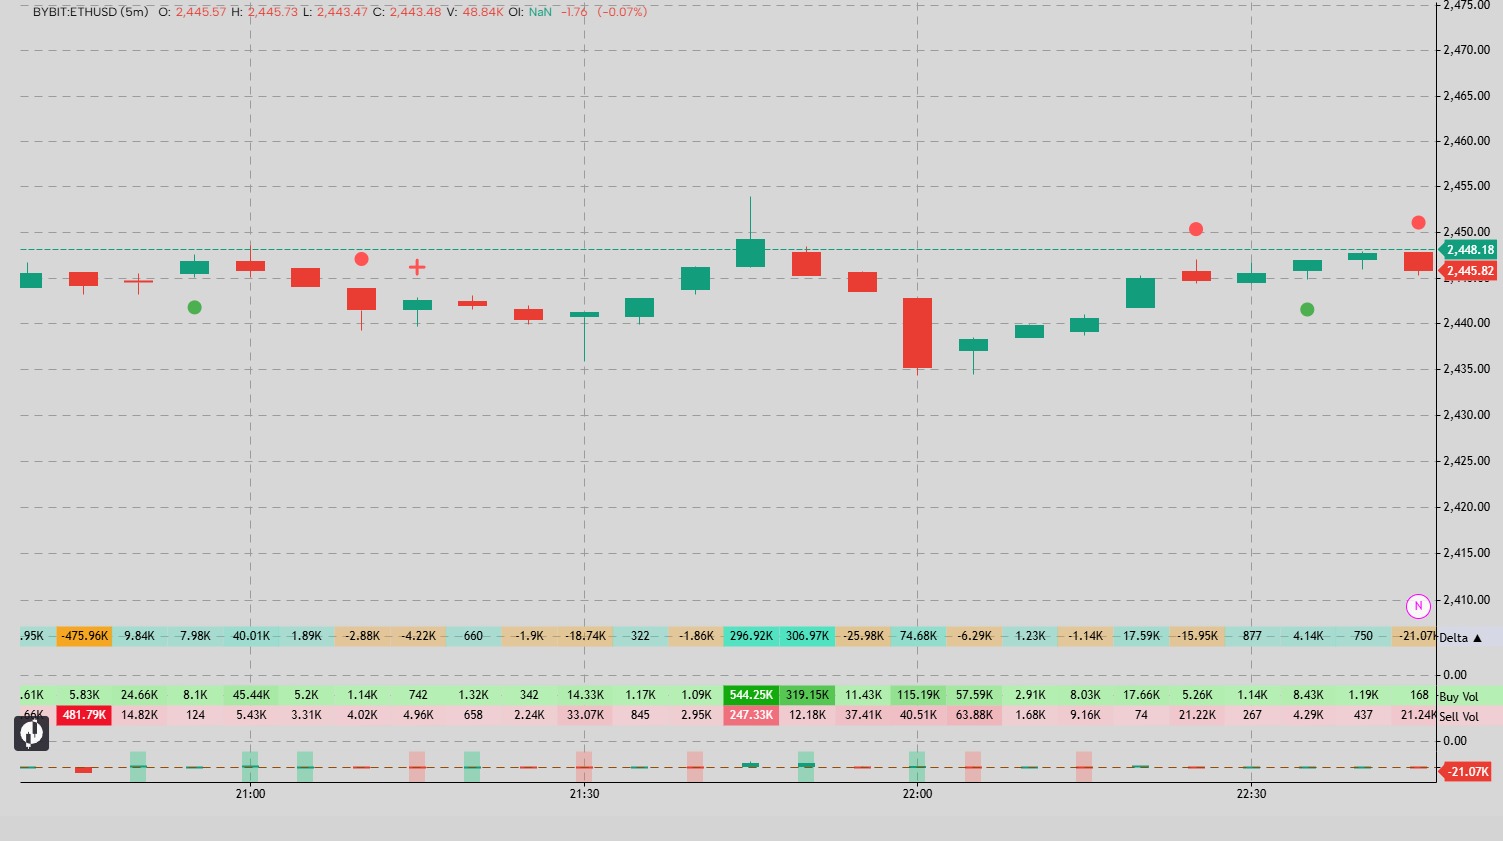
Strong buyers with less sellers and strong sellers with less buyers are highlighted with green and red dots respectively. The red and green cross on the candles appear when they are delta divergence.
Supported Markets
Lipi scripts work across all GoCharting markets — NSE/BSE Futures & Options, CME Futures (/ES, /NQ, /CL, /GC), Forex & Crypto and Indian equities. Orderflow metrics (delta, buy/sell volume, OI) are available wherever the underlying data feed supports them.