Auction Anchors

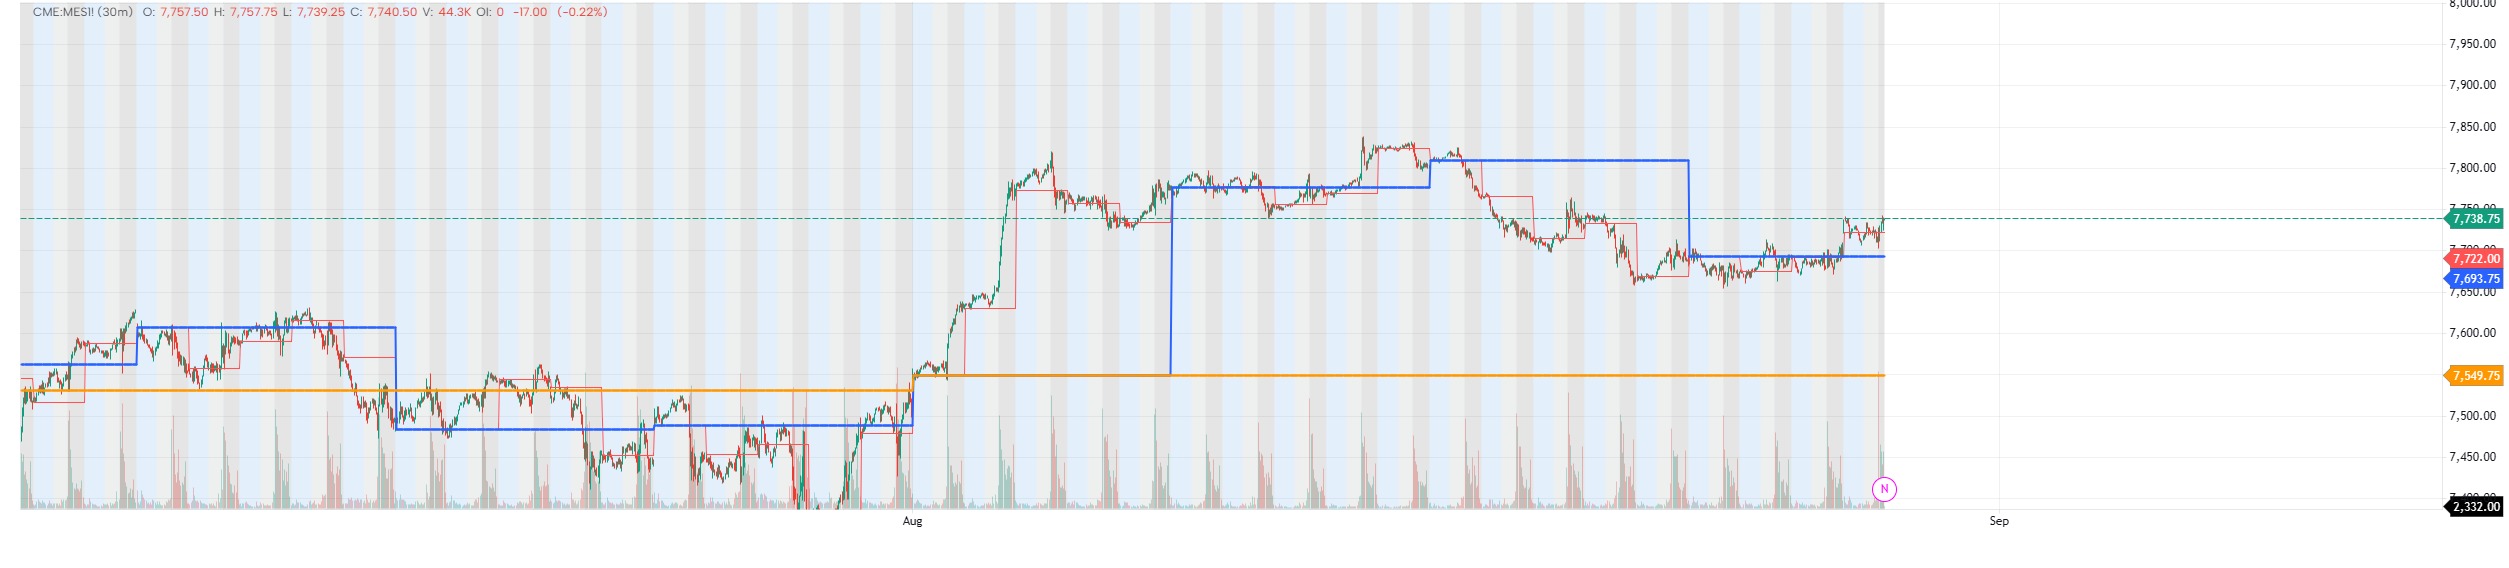
Daily • Weekly • Monthly Opens
Markets do not begin at random. Every new day, week and month starts a fresh auction. In Auction Market Theory the open is not decoration. It is the start of price discovery for that timeframe. An open inside prior value often precedes rotation. An open outside prior value with conviction often precedes imbalance. Alignment across monthly, weekly and daily opens raises probability. Conflict between them warns you that you may be trading a counter-move inside a larger auction.
This indicator plots the levels institutions actually use as reference: the Daily Open, Weekly Open and Monthly Open. Price is measured against these anchors so you can see, at a glance, whether the current auction is trading in premium or discount — and whether higher-timeframe structure supports or contradicts the move in front of you.
What it shows
Daily, Weekly and Monthly Opens as persistent reference lines
Optional True Opens
Live premium / discount state relative to each open
Clean, uncluttered overlay that stays readable on lower timeframes
Usage
Use the Monthly Open for swing bias.
Use the Weekly Open for the week’s draw.
Use the Daily Open for session execution.
One framework. Three timeframes.
Use in conjunction with Market Profile indicator for value areas.
The information and publications are not meant to be, and do not constitute, financial, investment, trading, or other types of advice or recommendations supplied or endorsed by GoCharting. Read more in the Terms of Use.
Comments (1)
Loading comments…