VOLUME CROSS OVER ALERT

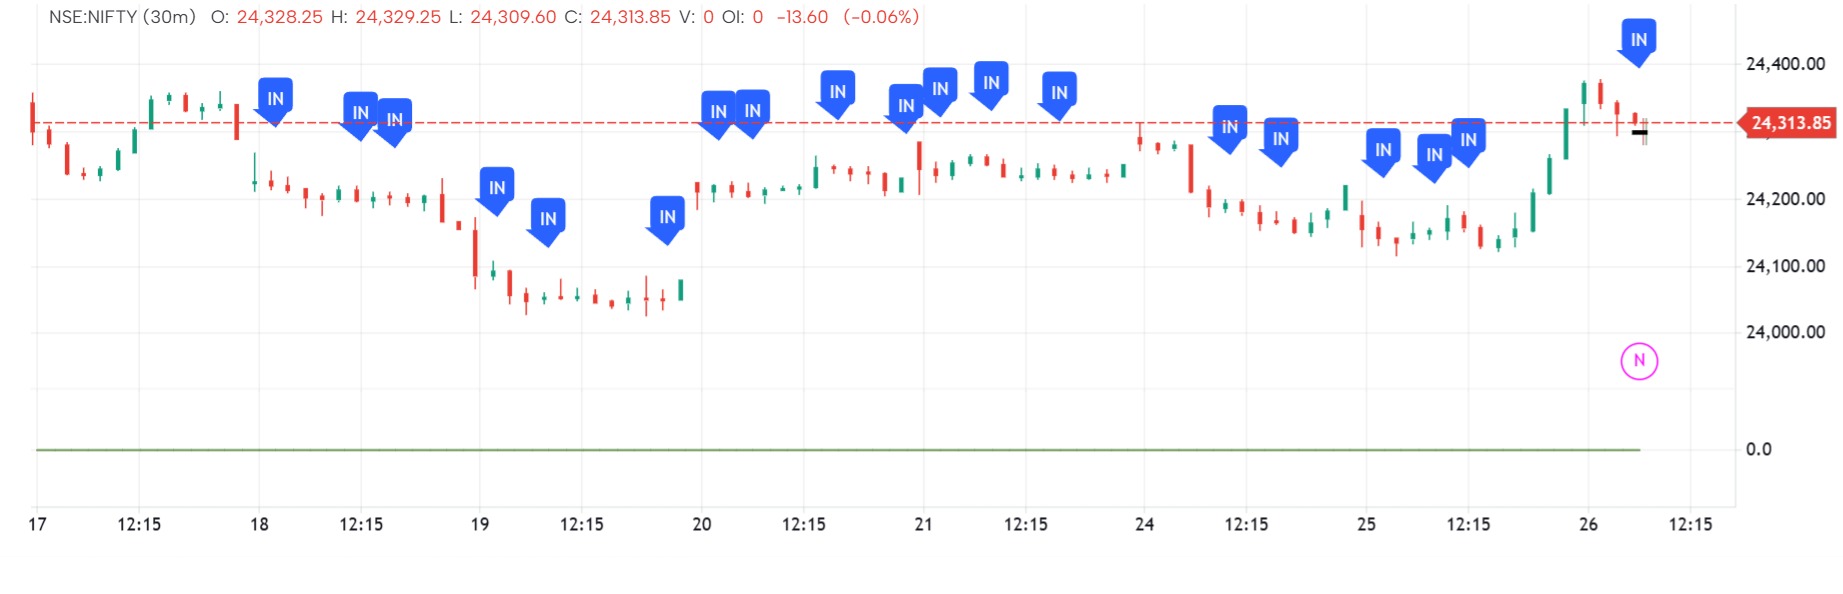
VOLUME CROSS OVER ALERT — Indicator Analysis
The VOLUME CROSS OVER ALERT indicator is designed to identify unusually strong volume activity by detecting when the current volume moves above a predefined statistical threshold.
Volume is one of the most useful tools for understanding the level of participation behind a price move. A significant increase in volume can indicate that a larger number of market participants are becoming active and that the current price movement may deserve closer attention.
What the Indicator Does
The indicator monitors the volume of the selected timeframe and generates an alert when volume crosses above the upper statistical threshold.
The threshold is based on the recent behaviour of volume, allowing the indicator to identify volume activity that is unusually high relative to its recent history.
This makes it particularly useful for spotting volume expansion without requiring the trader to continuously monitor the volume bars manually.
Why Volume Expansion Matters
A sudden increase in volume can occur when there is a significant change in market participation.
High-volume events may accompany:
Breakouts from important price levels
Strong trend continuation
Reversals
News or event-driven moves
Institutional participation
Panic buying or selling
The beginning of a volatility expansion
However, high volume by itself does not determine whether the market will move higher or lower. Volume measures participation, not direction.
How to Interpret the Alert
When the alert is triggered, the key question is not simply “Is volume high?” but rather:
“What is price doing while this unusual volume is occurring?”
For example:
High Volume + Breakout
If volume expands as price breaks above a well-defined resistance level, the increased participation may add significance to the breakout.
High Volume + Breakdown
If unusually high volume accompanies a break below support, it may indicate strong selling participation.
High Volume + Large Range
When exceptional volume occurs together with an unusually large price range, it can indicate a significant expansion in market activity.
High Volume + Little Price Movement
High volume without substantial price movement can also be important. It may indicate intense buying and selling activity occurring around an important price level.
Alert-Based Approach
One of the main advantages of the indicator is that it is designed around an alert rather than simply a visual volume study.
Instead of constantly watching the chart and waiting for an unusually large volume bar, the trader can use the alert to bring attention to the event when it occurs.
This is particularly useful when monitoring multiple instruments or higher timeframes where important volume events may occur infrequently.
Timeframe Flexibility
The significance of volume is relative to the timeframe being analysed.
A volume expansion on a 15-minute chart, for example, represents unusual participation during that intraday period. The same concept can be applied to other timeframes depending on the trader's strategy.
For meaningful interpretation, the volume threshold should always be considered in the context of the selected timeframe and instrument.
Important Consideration
A volume alert is not a standalone buy or sell signal.
Unusually high volume can occur at both the beginning and the end of a move. It can represent accumulation, distribution, breakout participation, panic, or simply event-driven activity.
The alert is therefore best used as a market-attention tool that tells the trader:
Something unusual is happening in volume — investigate the price action.
Key Takeaway
The VOLUME CROSS OVER ALERT indicator helps traders identify statistically unusual volume expansion without having to constantly monitor volume bars.
By drawing attention to volume crossing above its upper threshold, the indicator can help traders spot potential breakouts, reversals, trend acceleration, volatility expansion, and significant market participation.
Use the alert as a trigger for further analysis, and always combine volume information with price structure, trend, support and resistance, and subsequent price action before making a trading decision.
The information and publications are not meant to be, and do not constitute, financial, investment, trading, or other types of advice or recommendations supplied or endorsed by GoCharting. Read more in the Terms of Use.
Related Scripts
Comments (1)
Loading comments…