Institutional Order Flow

INSTITUTIONAL ORDER FLOW
===========================
OVERVIEW
--------
Institutional Order Flow is a price-action based volume indicator
designed to visually highlight moments where large volume enters the
market but fails to move price significantly in that direction. This
phenomenon is commonly referred to as "absorption" — where aggressive
buying or selling is being absorbed by opposing limit orders, often
indicating the presence of large institutional players, smart money,
or algorithmic trading activity.
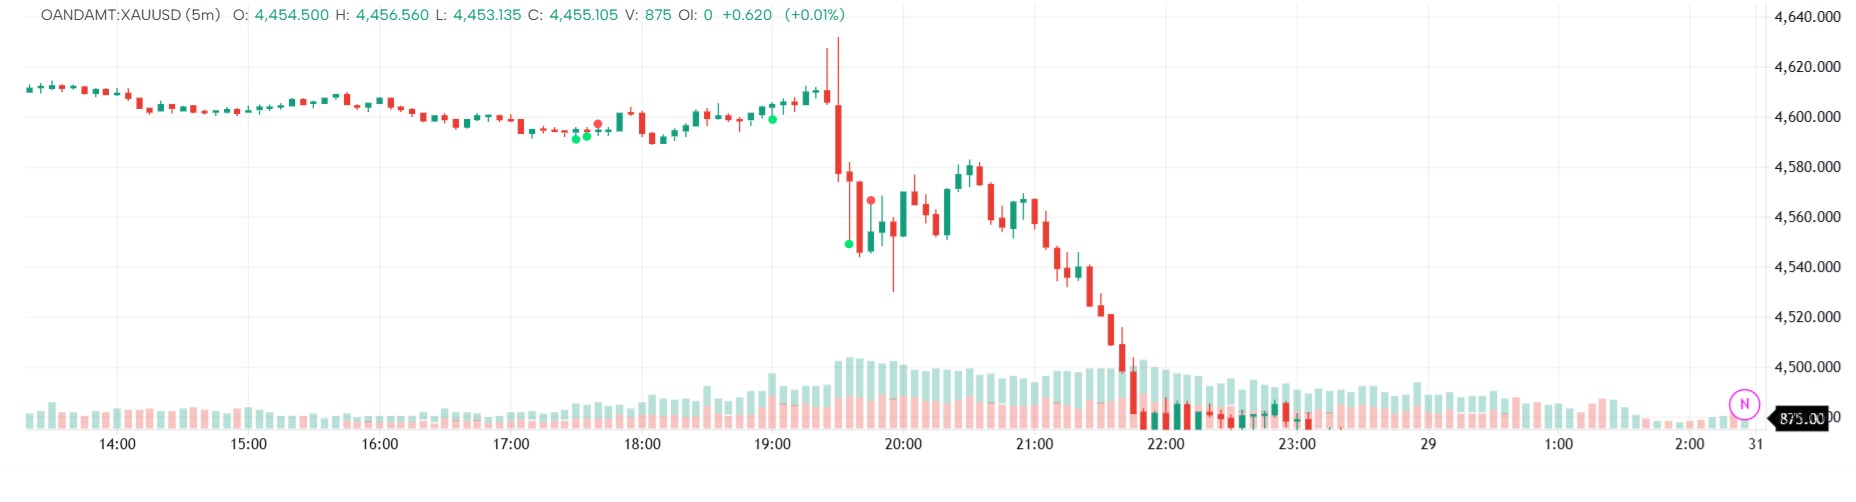
The indicator plots colored bubbles directly on the price chart at the
exact bar where absorption is detected, with the SIZE of each bubble
scaling dynamically based on the strength of the absorption event.
Bigger bubbles represent stronger, more significant absorption —
helping traders instantly distinguish minor noise from major,
potentially market-moving institutional activity.
WHAT IS ABSORPTION?
--------------------
Absorption occurs when one side of the market (buyers or sellers)
pushes aggressively into price, generating a volume spike, but the
opposing side "absorbs" that pressure — resulting in a long wick and
little to no net price movement in the aggressor's favor. This is
often the footprint left behind by large institutional orders working
against retail flow.
- BUY ABSORPTION: Heavy selling pressure hits the market (often visible
as a long lower wick), but buyers step in and absorb it, preventing
price from falling further. This can signal a potential reversal to
the upside or the presence of a strong institutional support zone.
- SELL ABSORPTION: Heavy buying pressure hits the market (long upper
wick), but sellers absorb it, capping the advance. This can signal
a potential reversal to the downside or a strong institutional
resistance zone.
HOW IT WORKS
------------
The indicator combines two independent conditions to confirm
institutional absorption:
1. VOLUME SPIKE DETECTION
The script calculates a moving average of volume over a user-defined
lookback period (default: 20 bars). A bar is flagged as "high volume"
when its volume exceeds this average multiplied by a sensitivity
factor (default: 1.5x). This filters out ordinary volume fluctuations
and isolates genuine institutional-sized spikes.
2. WICK RATIO DETECTION
For each bar, the script measures the lower wick (rejection of lower
prices) and upper wick (rejection of higher prices) relative to the
bar's total range (high minus low). A minimum wick ratio (default:
50%) must be met for a bar to qualify as showing rejection strong
enough to represent institutional absorption rather than simple
continuation.
Only bars that satisfy BOTH conditions simultaneously — a volume spike
AND a dominant wick — are marked as institutional order flow events.
DYNAMIC BUBBLE SIZING
-----------------------
Once a bar is confirmed as an absorption event, the indicator calculates
a "strength score" for that bar. This score combines:
- How far volume exceeded the volume spike threshold
- How far the wick ratio exceeded the minimum wick threshold
The two factors are multiplied together, so an event with BOTH
extremely high volume AND an extremely long wick — the clearest sign
of large institutional participation — produces a much higher strength
score than an event that only barely qualifies.
This strength score is then mapped into four visual size tiers:
SMALL - Minor absorption, volume/wick just above threshold
MEDIUM - Moderate absorption, noticeably above threshold
LARGE - Strong absorption, well above threshold
XL - Extreme absorption, likely large institutional trades
Each tier is rendered with a progressively larger bubble, giving traders
an immediate visual sense of institutional conviction strength without
needing to hover over or inspect individual bars.
INPUTS
------
- Volume Average Length (default 20)
Number of bars used to calculate the baseline average volume. Shorter
lengths make the indicator more reactive to recent volume changes;
longer lengths smooth out noise and focus on more significant
institutional-sized spikes.
- Volume Spike Multiplier (default 1.5)
How many times above average volume a bar must be to qualify as a
volume spike. Increasing this value filters for only the most
extreme, likely institutional, volume events.
- Minimum Wick Ratio (default 0.50)
The minimum proportion of the bar's total range that must be composed
of rejection wick. Higher values require more dramatic rejection
before flagging institutional absorption.
VISUAL OUTPUT
--------------
- LIME/GREEN bubbles (below price): Buy-side institutional absorption —
sellers were absorbed, potential bullish signal or support forming.
- RED bubbles (above price): Sell-side institutional absorption —
buyers were absorbed, potential bearish signal or resistance forming.
- Bubble size: Represents the relative strength of the institutional
order flow event, from small (minor) to XL (extreme/high-conviction).
HOW TO USE IT
--------------
1. Watch for clusters of same-colored bubbles, which may indicate a
developing institutional support or resistance zone being
repeatedly defended.
2. Pay closer attention to LARGE and XL bubbles, as these represent
the most significant absorption events and are more likely to be
associated with genuine institutional or large-trader activity.
3. Combine with other tools such as trend structure, order blocks, or
key support/resistance levels for higher-confidence signals. This
indicator is best used as a confirmation tool rather than a
standalone entry trigger.
4. Consider adjusting the Volume Average Length and Volume Spike
Multiplier depending on the asset and timeframe — highly liquid
assets or lower timeframes may require more conservative (higher)
thresholds to avoid excessive signals.
LIMITATIONS
------------
- This indicator is reactive, not predictive — it identifies
institutional order flow footprints after the bar has closed and
does not forecast future price movement.
- Volume data quality varies by asset and exchange. On markets with
incomplete or aggregated volume feeds (e.g., some spot crypto pairs
or forex), signal reliability may be reduced.
- Absorption does not guarantee a reversal; it only indicates that
significant opposing pressure was present. Price may continue in
the original direction after a period of consolidation.
- As with all volume/wick-based tools, this indicator works best in
liquid markets with consistent volume reporting, and may be less
reliable during illiquid sessions, holidays, or on synthetic indices.
- The term "institutional" refers to the inferred size/character of the
order flow based on volume and price rejection patterns — it does not
confirm the actual identity or intent of market participants.
DISCLAIMER
-----------
This indicator is provided for informational and educational purposes
only. It does not constitute financial advice, and past patterns of
institutional order flow do not guarantee future results. Always use
proper risk management and combine this tool with your own independent
analysis before making trading decisions.
The information and publications are not meant to be, and do not constitute, financial, investment, trading, or other types of advice or recommendations supplied or endorsed by GoCharting. Read more in the Terms of Use.
Comments (1)
Loading comments…